
Fig. 3
- ID
- ZDB-IMAGE-071005-70
- Genes
- Publication
- Bateman et al., 2004 - Expression of the zebrafish Staufen gene in the embryo and adult
- All Figures
- Figures for Bateman et al., 2004
|
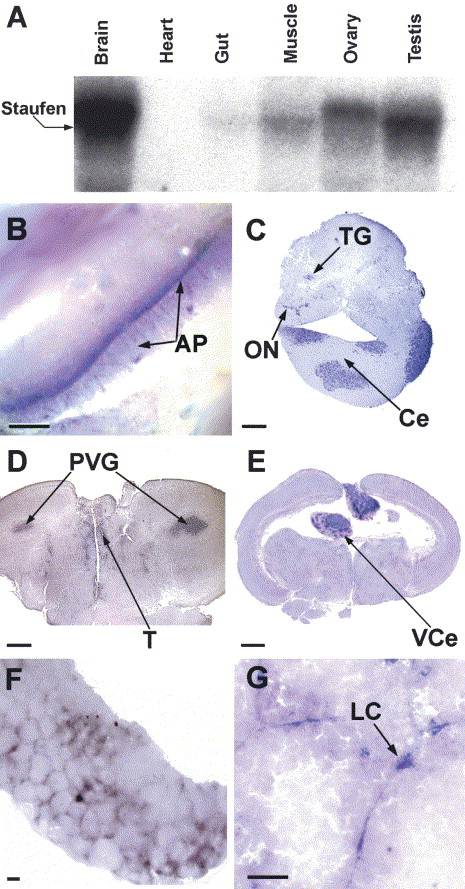
Fig. 3 (A) Characterization of staufen expression in tissues of the adult zebrafish using Northern blot analysis. Twenty microgram of total RNA from brain, heart, gut, muscle, ovary, and testis were separated by electrophoresis on 1% agarose/formaldehyde gels and transferred to nitrocellulose membranes. The membranes were hybridized with 32P labeled staufen cDNA probes and exposed to X-ray film. Ethidium bromide staining of 28S and 18S rRNA served as loading controls. (B) Localization of staufen expression in the adult brain by in situ hybridization. Axonal tracts and processes (AP) located on the ventral surface of the brain express staufen. (C–E) Staufen in situ hybridization in sectioned zebrafish brain. (C) Staufen expression in the descending trigeminal root (TG), descending octaval nucleus (ON), and in nuclei of the primitive cerebellum (Ce). (D) Staufen expression in the periventricular gray zone (PVG) of the optic tectum and the thalamus (T). (E) Staufen expression in the vulvula cerebelli (Vce). Localization of staufen expression in the adult zebrafish testis by whole mount and sectioned in situ hybridization. (F) Whole mount in situ hybridization. (G) Cross section of the zebrafish testis demonstrating staufen localization in the Leydig cell (LC). Magnifications: B and G=100 μm; C, D, and E=2 mm; F=1 mm.
Reprinted from Gene expression patterns : GEP, 5(2), Bateman, M.J., Cornell, R., d'Alencon, C., and Sandra, A., Expression of the zebrafish Staufen gene in the embryo and adult, 273-278, Copyright (2004) with permission from Elsevier. Full text @ Gene Expr. Patterns