
|
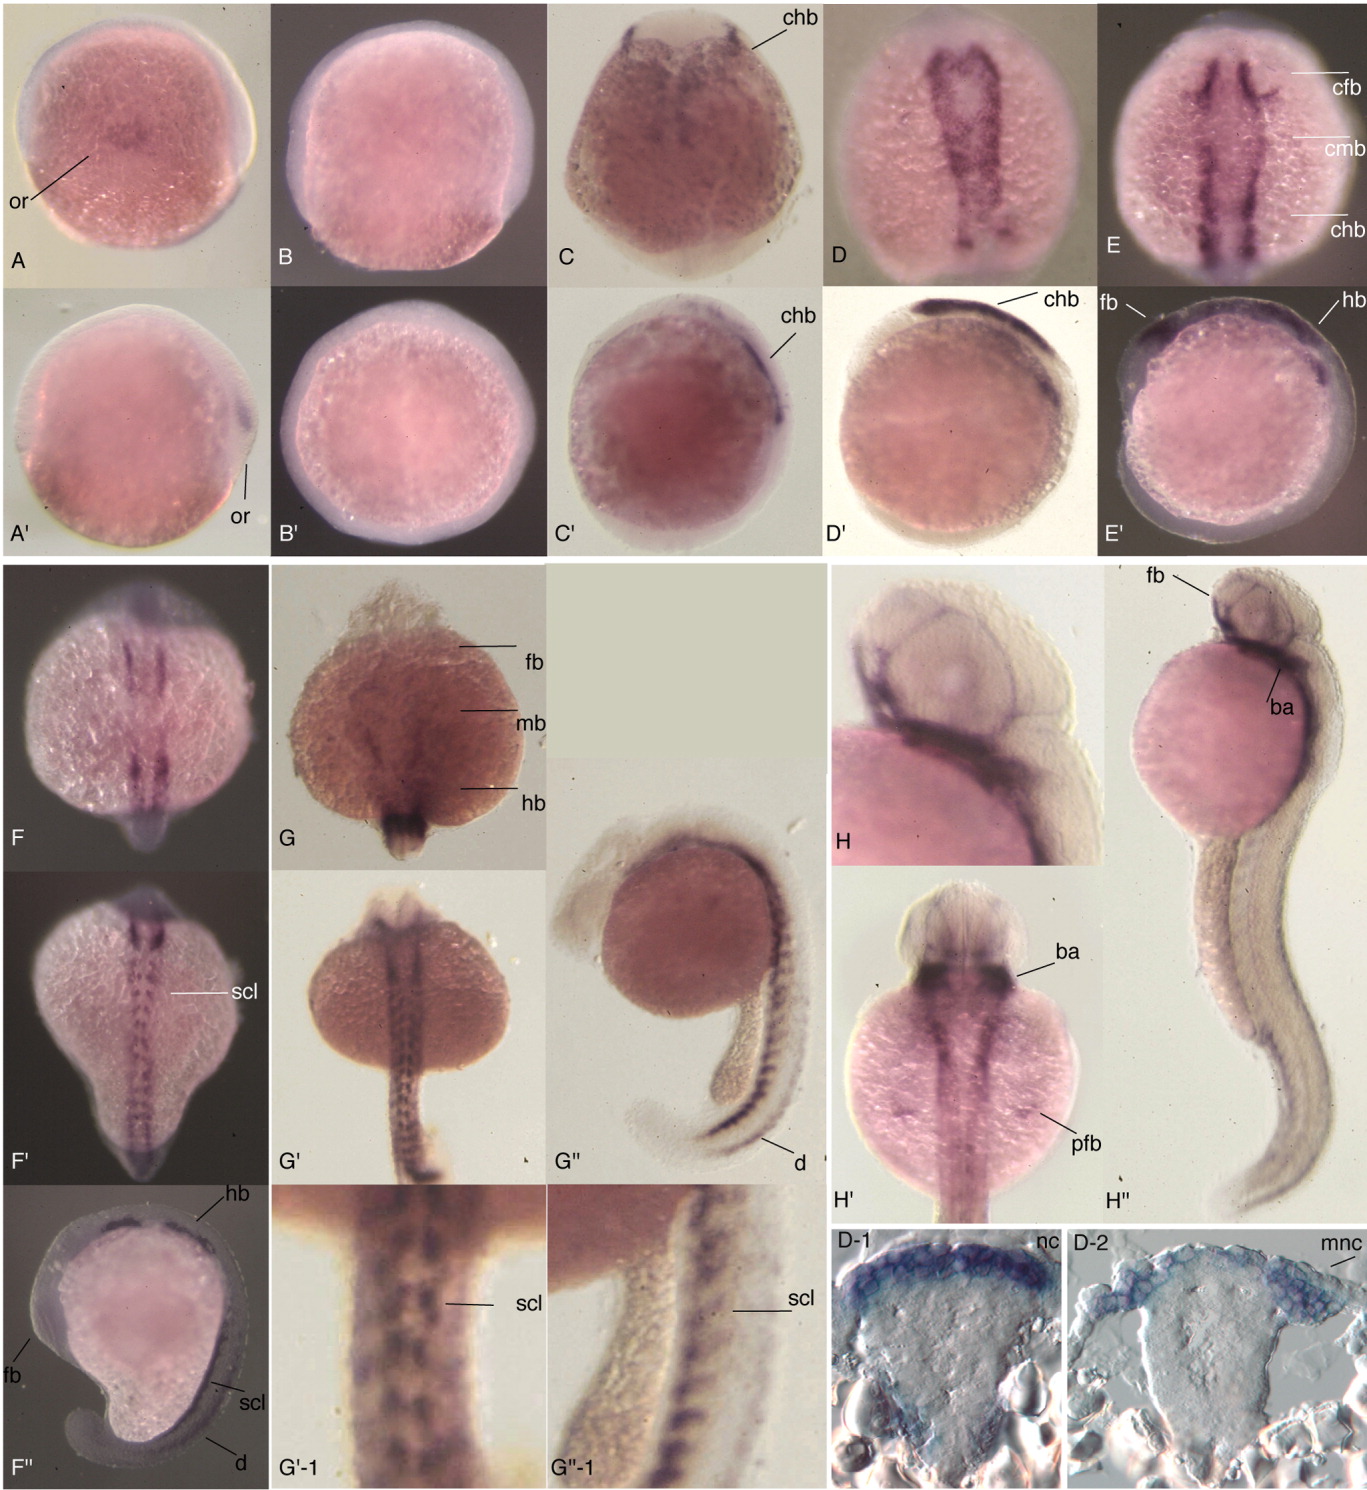
Fig. 3 Embryonic mRNA expression pattern of the zebrafish twist1a gene. All images labeled with the same letter represent the same embryo in different views. All images are oriented with rostral at the top; in all lateral views anterior is to the left. Embryos shown are at the following stages: A, ∼60% epiboly; B, ∼75% epiboly; C, 2-3 somites; D, 6-8 somites; E, 10-12 somites; F, 15 somites; G, 24 somites; H,36 hpf. A-E: Dorsal views; A′-E′: lateral views, except B′, which shows the animal pole view. F,G: Head region, dorsal view; H: ventro-lateral view; F′-H′: body, dorsal view; F′-H′: lateral view; G′-1, G′-1: higher magnification of the dorsal and lateral views of the trunk region and the migrating sclerotome; D-I: DIC image of 6-8 somites embryo section through the hindbrain. ba, branchial and pharyngeal arches; cfb, chb, cmb, neural crest at the level of the fore-, hind-, and midbrain; d, dorsal somite; fb, forebrain area; hb, hindbrain area; mb, midbrain area; mnc, migratory neural crest; nc, neural crest; or, organizer region; pfb, pectoral fin bud primordia; scl, sclerotome.