
|
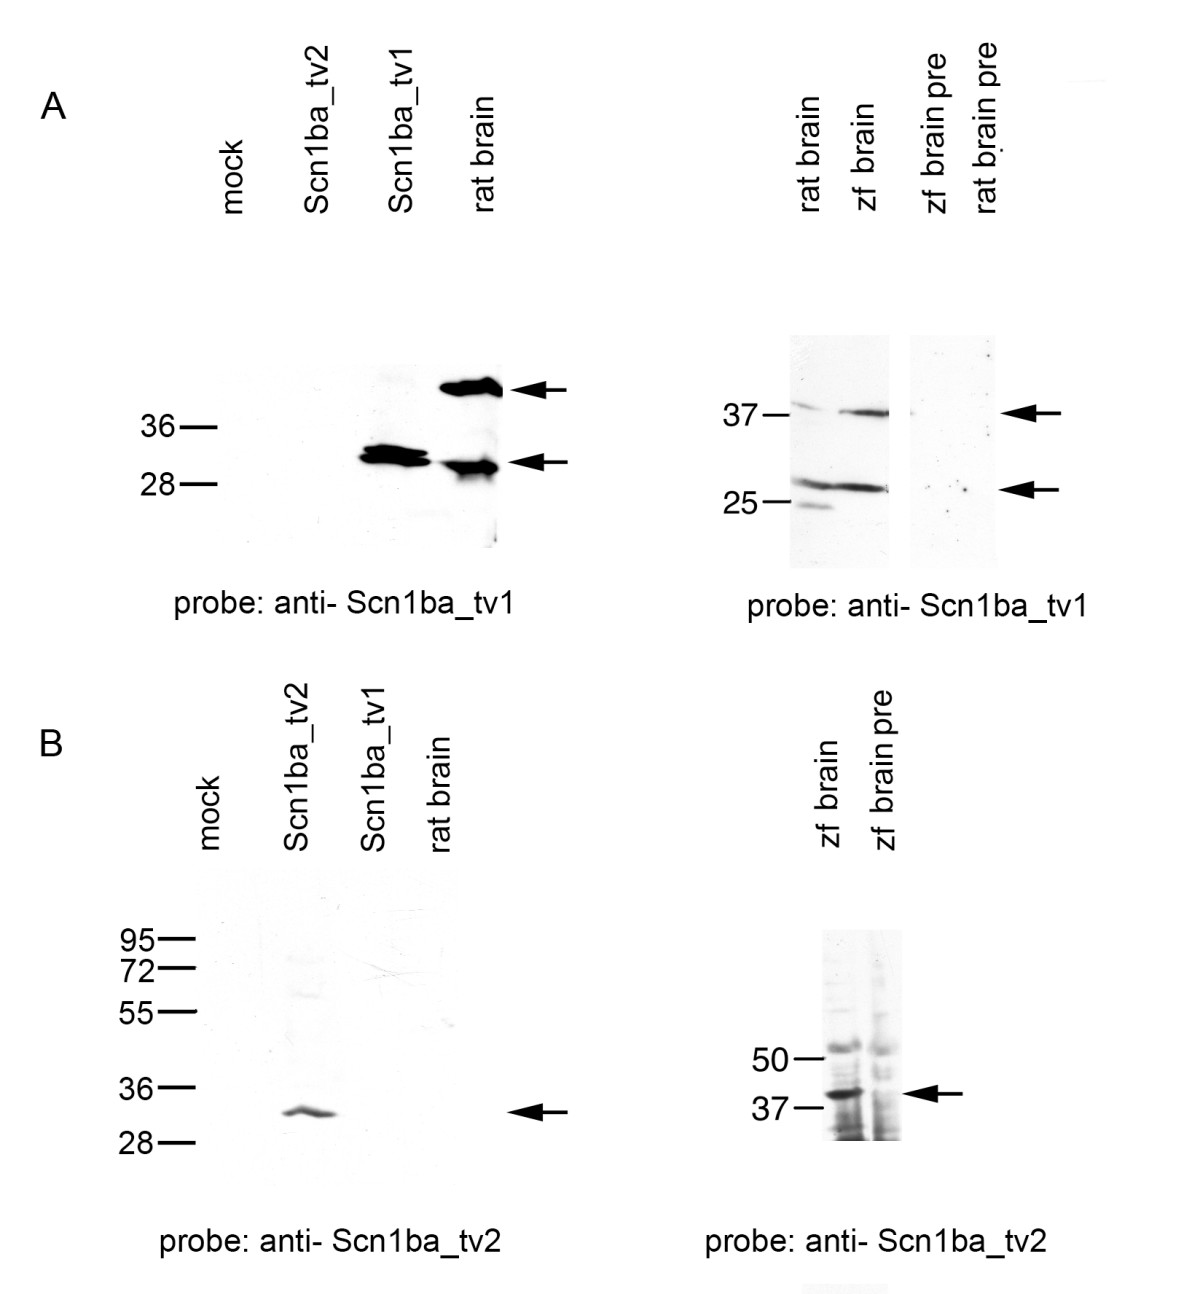
Fig. 3 Antibody characterization. A. Left panel: Western blot probed with anti-Scn1ba_tv1. Lane 1: mock transfected Chinese hamster lung 1610 cells; Lane 2: Chinese hamster lung 1610 cells transiently transfected with scn1ba_tv2 cDNA; Lane 3: Chinese hamster lung 1610 cells transiently transfected with scn1ba_tv1 cDNA; Lane 4: 5 μg rat brain membranes. Arrows indicate immunoreactive bands at ~30 kD in the transfected cells and at ~30 kD and ~38 kD in rat brain. Right panel: Western blot probed with anti-Scn1ba_tv1. Lane 1: 5 μg rat brain membranes; Lane 2: 15 μg zebrafish brain membranes; Lane 3: 5 μg rat brain membranes probed with anti-Scn1ba_tv1 that had been preadsorbed to the immunizing peptide ("pre"); Lane 4: 15 μg zebrafish (zf) brain membranes probed with anti-Scn1ba_tv1 that had been preadsorbed to the immunizing peptide. Arrows indicate immunoreactive bands at ~30 kD and ~38 kD in both species. B. Left panel: Western blot probed with anti-Scn1ba_tv2. Lane 1: mock transfected Chinese hamster lung 1610 cells; Lane 2: Chinese hamster lung 1610 cells transiently transfected with scn1ba_tv2 cDNA; Lane 3: Chinese hamster lung 1610 cells transiently transfected with scn1ba_tv1; Lane 4: 5 μg rat brain membranes. Arrow indicates immunoreactive band at ~30 kD. Right panel: Western blot probed with anti-Scn1ba_tv2. Lane 1: 15 μg zebrafish brain membranes; Lane 2: 15 μg zebrafish brain membranes probed with anti-Scn1ba_tv2 that had been preadsorbed to the immunizing peptide ("pre"). Arrow shows immunoreactive band at ~38 kD.