
Fig. 2
- ID
- ZDB-IMAGE-070822-2
- Genes
- Publication
- Shi et al., 2006 - Zebrafish foxe3: Roles in ocular lens morphogenesis through interaction with pitx3
- All Figures
- Figures for Shi et al., 2006
|
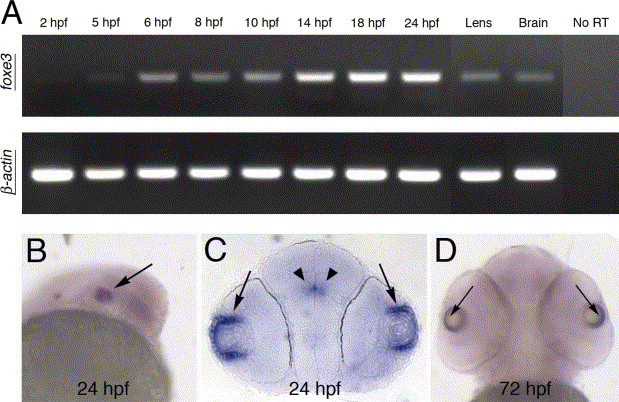
Fig. 2 Temporal and spatial expression of the foxe3 gene. (A) RT-PCR demonstrates the temporal expression of foxe3 during embryonic development. A low level of maternal foxe3 transcript is detected (2 hpf) and foxe3 expression levels increase at 14–18 hpf. In addition, foxe3 transcription is detected in adult lens and brain. As a control, β-actin amplification is shown in the lower panel. (B–D) Whole-mount in situ hybridization demonstrates foxe3 spatial expression at 24 and 72 hpf. Expression of foxe3 is largely restricted to the eye (panel B, arrow) with highest transcript levels detected in the lens epithelial cells at 24 and 72 hpf (arrows in panels C and D, respectively). Restricted expression within the brain is also detected at 24 hpf (panel C, arrowheads).
Reprinted from Mechanisms of Development, 123(10), Shi, X., Luo, Y., Howley, S., Dzialo, A., Foley, S., Hyde, D.R., and Vihtelic, T.S., Zebrafish foxe3: Roles in ocular lens morphogenesis through interaction with pitx3, 761-782, Copyright (2006) with permission from Elsevier. Full text @ Mech. Dev.