
|
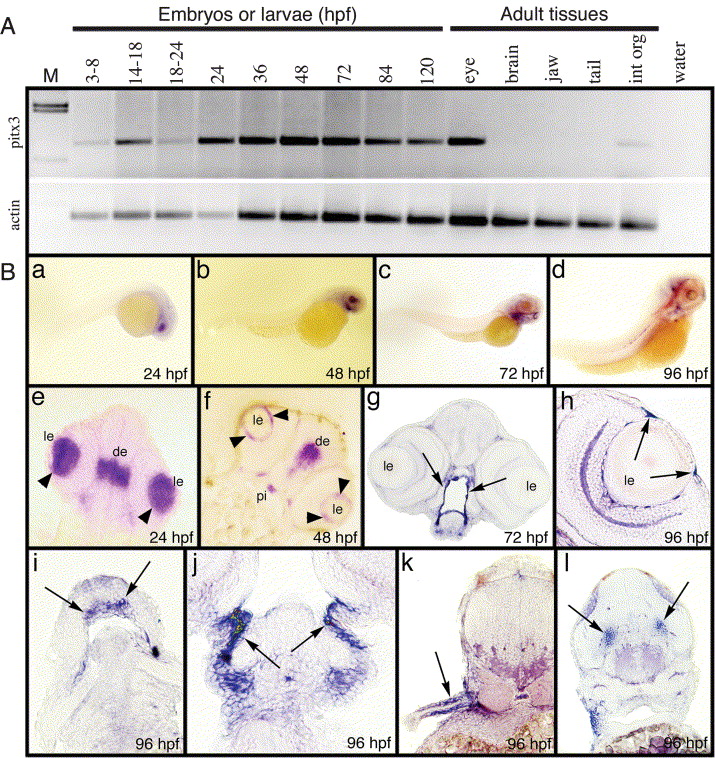
Fig. 2 Temporal and spatial expression patterns of the pitx3 gene. (A) RT-PCR results from cDNA isolated from various staged embryos and larvae. Additionally, RT-PCR products resulting from different adult tissues are shown. Molecular weight markers and a control PCR reaction lacking DNA template are shown in the first and last lanes, respectively. The lower panel shows amplification of β-actin as a control. (B) The in situ hybridization of embryos and larvae using the full-length pitx3 riboprobe. Whole-mount embryos at 24, 48, 72 and 96 hpf (a–d). Frontal sections of 24, 48 and 72 hpf embryos at the level of the eye (e–g). The arrowheads in (e) and (f) point to lens, while expression surrounding the mouth is shown in (g). At 96 hpf, expression is shown within the iris (h), Meckel′s cartilage (i), branchial arch (j), pectoral fin (k) and lateral trunk (l). Abbreviations: de, diencephalon; le, lens; pi, pituitary.
Reprinted from Mechanisms of Development, 122(4), Shi, X., Bosenko, D.V., Zinkevich, N.S., Foley, S., Hyde, D.R., Semina, E.V., and Vihtelic, T.S., Zebrafish pitx3 is necessary for normal lens and retinal development, 513-527, Copyright (2005) with permission from Elsevier. Full text @ Mech. Dev.