
IMAGE
Fig. 3
- ID
- ZDB-IMAGE-070619-3
- Genes
- Publication
- Shu et al., 2007 - Na,K-ATPase α2 and Ncx4a regulate zebrafish left-right patterning
- All Figures
- Figures for Shu et al., 2007
Image
|
Figure Caption
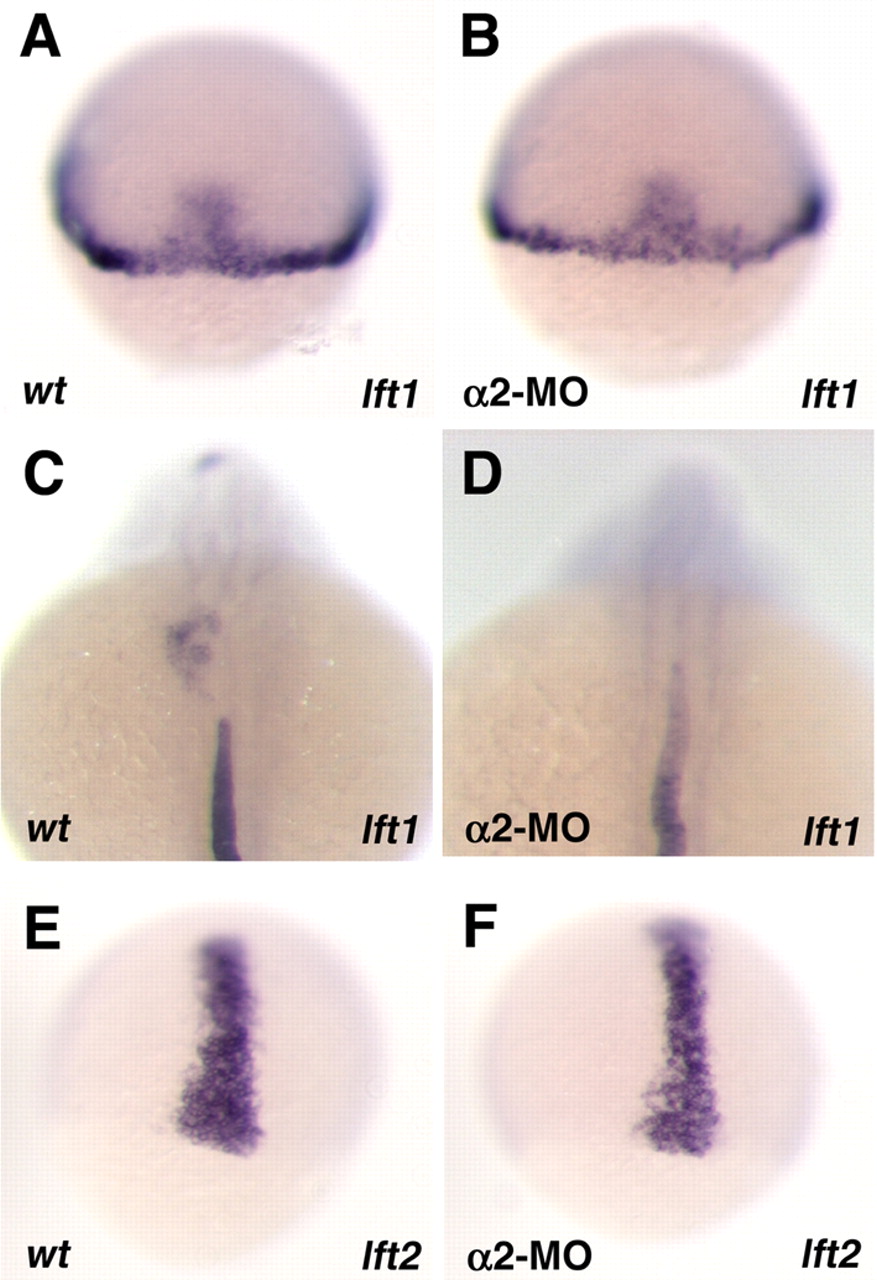
Fig. 3 The expression of lft1 and lft2 in zebrafish α2 morphants. Examples of lft1 (A-D) and lft2 (E,F) expression in wild type (wt, A,C,E) and α2 morphants (B,D,F) at the shield stage (A,B), 75% epiboly (E,F) and 22-somite stage (C,D).
Figure Data
Acknowledgments
This image is the copyrighted work of the attributed author or publisher, and
ZFIN has permission only to display this image to its users.
Additional permissions should be obtained from the applicable author or publisher of the image.
Full text @ Development