
Fig. 9
- ID
- ZDB-IMAGE-070307-20
- Genes
- Publication
- Nyholm et al., 2007 - The zebrafish zic2a-zic5 gene pair acts downstream of canonical Wnt signaling to control cell proliferation in the developing tectum
- All Figures
- Figures for Nyholm et al., 2007
|
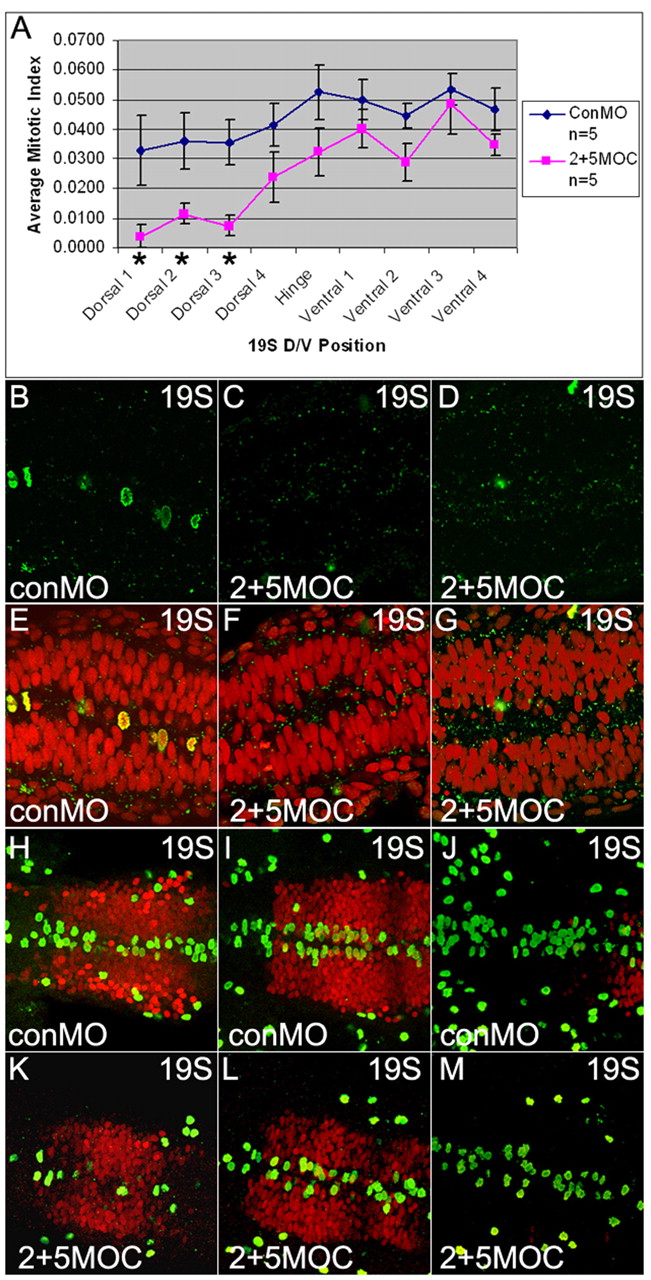
Fig. 9 Cell proliferation is reduced in the dorsal midbrain of zic morphants. (A) A comparison of average mitotic index in control (blue) and 2MOC+5MOC (pink) morphant midbrains. Mitotic index (y-axis) was calculated at nine DV positions (x-axis) at the 19-somite stage. Error bars show s.e.m. Asterisks mark statistically significant reductions in mitotic index. (B-D) PH3 (green) staining in representative confocal z-sections through midbrain dorsal position 3 in control (B) and zic MO-injected (C,D) embryos. (E-G) A merge of PH3 and nuclear ToPro3 (red) staining in embryos shown above. (H-M) Confocal z-stacks of 19-somite conMO (H-J) and 2MOC+5MOC-injected (K-M) embryos immunostained for Pax7 (red) and PH3 (green). H,K are stacks of dorsal-most Pax7 domain; I,L are stacks of ventral Pax7 domain; J,M are stacks of ventral midbrain.