
|
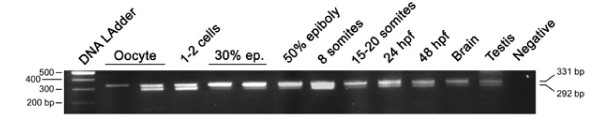
Fig. 3 Developmental RT-PCR analysis of the otp1 transcripts. Ethidium Bromide-stained agarose gel of RT-PCRs performed using the zotpS and zotpRv primers: DNA Ladder (lane 1), oocyte (lanes 2 and 3), 1-2 cell stage (lane 4), 30% epiboly (lanes 5 and 6), 50% epiboly (lane 7), 8 somite stage (lane 8), 15-20 somite stage (lane 9), 24 hpf (lane 10), 48 hpf (lane 11), brain (lane 12), testis (lane 13), and negative control (lane 14) in absence of cDNA. 80% epiboly, 1-2 somites, and 10 somites samples (not shown) resulted positive after the analysis. On the left of the panel is shown the size of the DNA Ladder bands, on the right is indicated the size of the 2 PCR products, 292 bp and 331 bp, corresponding to the short and the long form of the otp1 mRNA, respectively.