
Fig. 4
- ID
- ZDB-IMAGE-061228-4
- Genes
- Publication
- Zolessi et al., 2006 - Polarization and orientation of retinal ganglion cells in vivo
- All Figures
- Figures for Zolessi et al., 2006
|
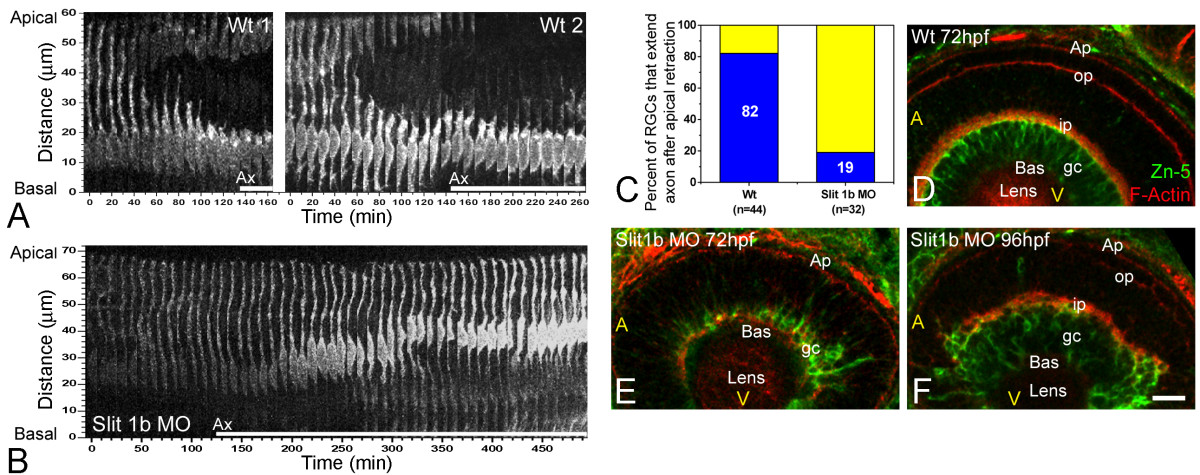
Fig. 4 The timing of axon formation does not correlate with the dynamics of apical retraction. (a) Time-series images of the cells shown in Figure 2b, showing the retraction of the apical process in a wild-type embryo (also see Figure 3). (b) A similar analysis performed in an ath5:gap-gfp transgenic embryo, injected with 2 ng of morpholino to Slit1b. The cell is able to extend an axon (not shown in the picture; see Additional file 3) but does not retract its apical process during the time of the movie (more than 8 hours). The age of the embryo at the start of the movie was about 48 hpf. The white bars under the time-series images indicate the presence of an axon (Ax, not seen in the pictures). (c) Comparison of the percentage of retinal ganglion cells (RGCs) forming their axons before or after the detachment of the apical process in wild-type and Slit1b morpholino-injected embryos, as analyzed by four-dimensional microscopy; n is the number of cells followed in 12 wild-type and 7 morphant embryos. (d-f) Parasagittal optical sections of wild-type and Slit1b-treated embryos, labeled for RGCs (gc) with Zn-5, and for F-actin with phalloidin-Texas red, which predominantly stains the inner plexiform (ip) and outer plexiform (op) layers, and the outer limiting membrane (Ap). Bas, basal; A, anterior, V, ventral. Scale bar, 10 μm.