
Image
|
Figure Caption
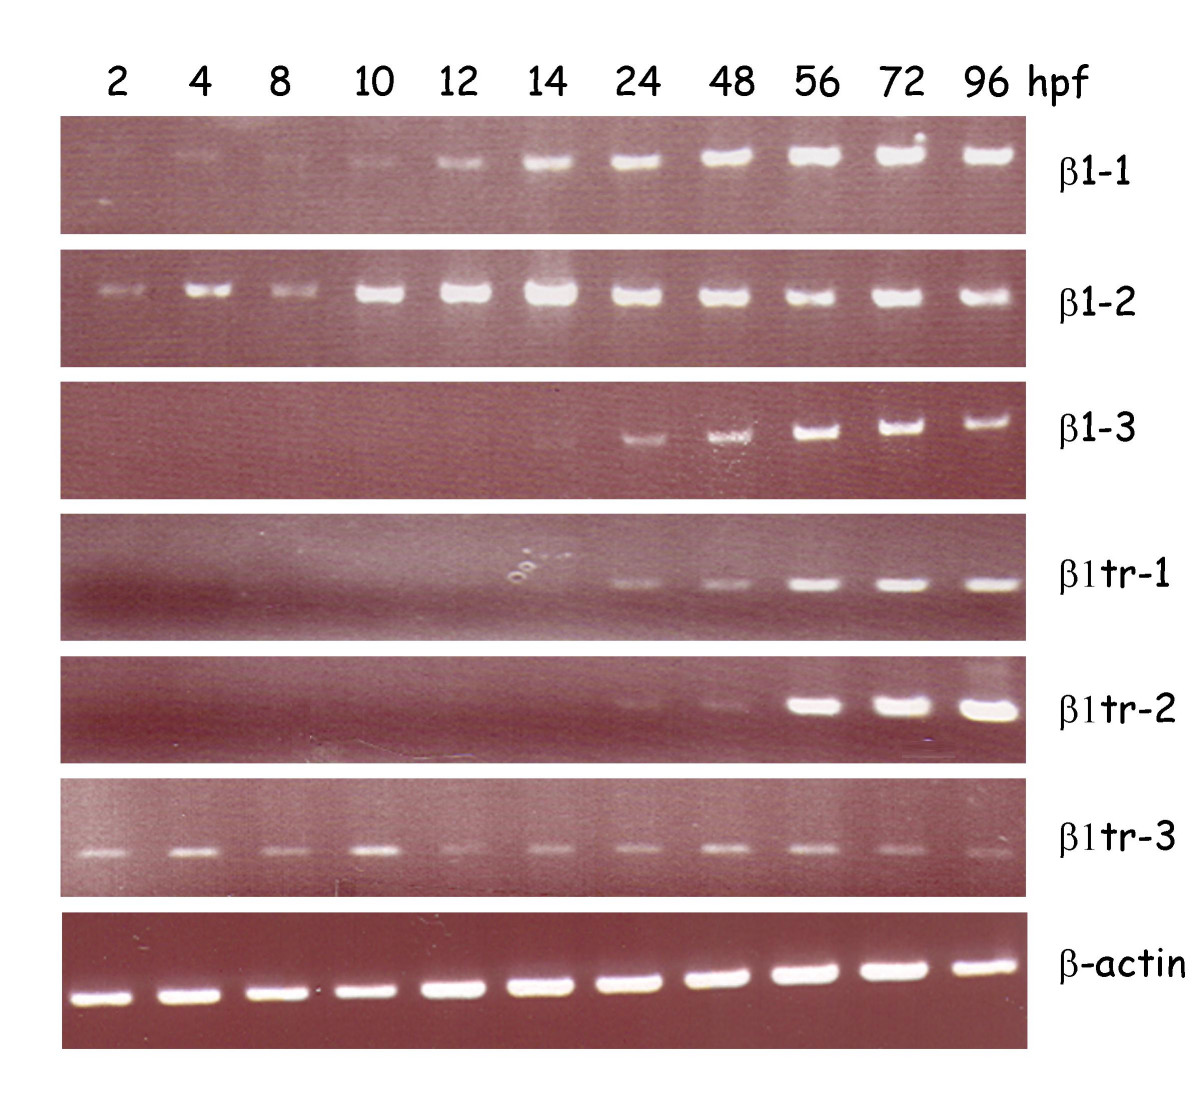
Fig. 7 Expression profiling of zebrafish β1 paralogs during development. Expression of the different paralogs at 2, 4, 6, 8, 12, 14, 24, 48, 56, 72 and 96 hpf (hours post fertilization) was analyzed by semiquantitative RT-PCR using primers designed against a portion of extracellular domains of the different paralogs. The amplification of zebrafish β-actin was monitored as a positive control.
Figure Data
Acknowledgments
This image is the copyrighted work of the attributed author or publisher, and
ZFIN has permission only to display this image to its users.
Additional permissions should be obtained from the applicable author or publisher of the image.
Full text @ BMC Cell Biol.