
Image
|
Figure Caption
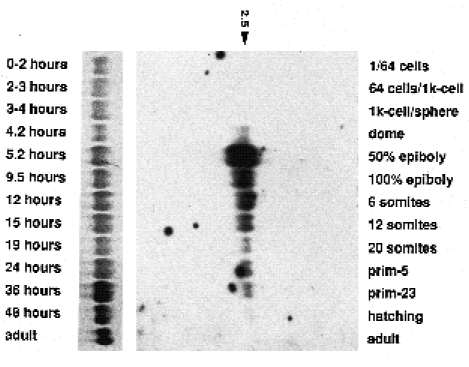
Fig. 3 Temporal expression pattern of Zf-T. 10 μg of total RNA of the indicated stages were blotted. Staging was done according to Westerfield (1989). A single transcript of about 2.5 kb was detected upon probing with the entire insert of pBSCT-ZFc1. The left panel shows methylene blue staining of ribosomal RNA of the same blot.
Figure Data
Acknowledgments
This image is the copyrighted work of the attributed author or publisher, and
ZFIN has permission only to display this image to its users.
Additional permissions should be obtained from the applicable author or publisher of the image.
Full text @ Development