
|
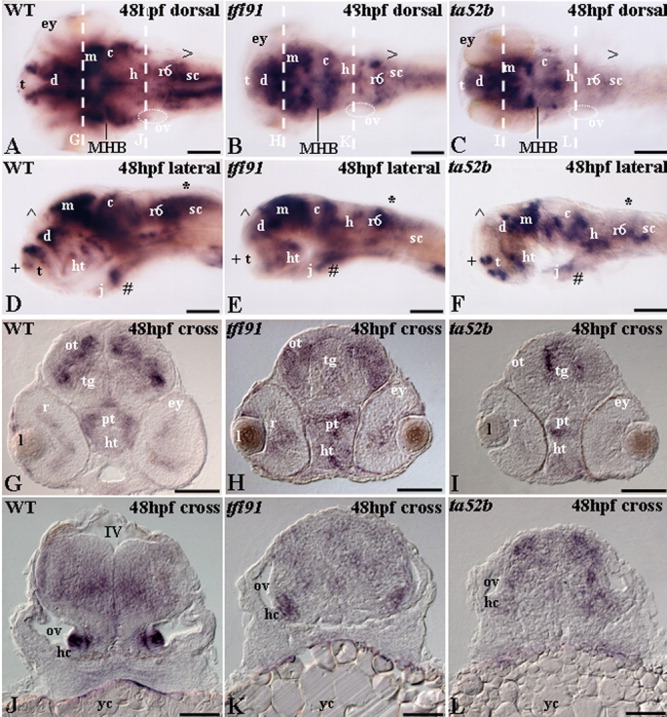
Fig. 5 id2 expression is down-regulated in mind bomb mutants. A-F: Whole-mount; A,D,G,J: control; B,E,H,K: mibtfi91; C,F,I,L: mibta52b. A-C: Dorsal views (eyes at different focal depth at dorsal part of embryo). A-C: Comparison between control and mind bomb mutants show differences in expression in the midbrain, cerebellum, otic vesicle, and hindbrain cells. D-F: Lateral views provide a different perspective of id2 expression in dorsal and ventral telencephalon, hypothalamus, midbrain, cerebellum, otic vesicle, and hindbrain cells. Eyes dissected out to enhance clarity of the brain region in all lateral views. G-L: Cross-sections. G-I: Sibling and mutants showing id2 expression in cells of optic tectum, tegmentum, and hypothalamus and the amacrine cells expressing id2. J-L: Hindbrain showing id2 transcripts in the precursors associated with glia and hair cells. White dashed lines in A-C indicate the level of the section. c, cerebellum; d, diencephalons; ey, eye; h, hindbrain; hc, hair cells; ht, hypothalamus; IV, fourth ventricle; j, jaw; l, lens; m, midbrain; mhb, midbrain-hindbrain boundary; ot, optic tectum; ov, otic vesicle; pt, posterior tuberculum; r, retina; r6, rhombomere 6; sc, spinal cord; t, telencephalon; tg, tegmentum; yc, yolk cell. >, +, *, and # are examples that indicate corresponding areas in the wild-type and mind bomb mutants where id2 expression is different. Scale bars = 50 μ m.