
Fig. 9
- ID
- ZDB-IMAGE-051107-8
- Genes
- Publication
- Honjo et al., 2005 - Slow muscle regulates the pattern of trunk neural crest migration in zebrafish
- All Figures
- Figures for Honjo et al., 2005
|
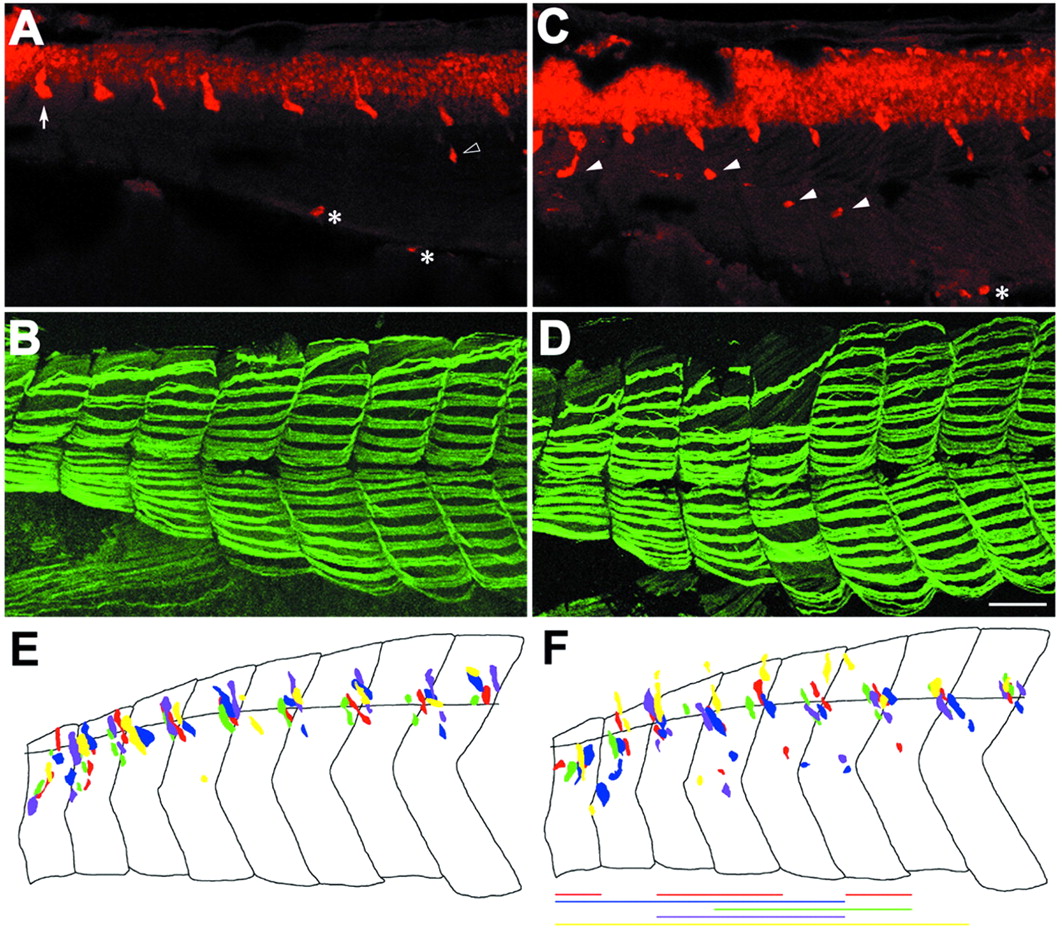
Fig. 9 Slow muscle removal results in aberrant DRGs. (A-D) Views of a single 72 hpf embryo: (A,B) control side; (C,D) experimental side. All figures are printed with anterior toward the left and dorsal toward the top for ease of comparison. (A,C) Anti-HuC antibody staining (red) reveals clusters of DRG neurons adjacent to the neural tube. DRGs are indicated only in the first segment in A (arrow). Enteric neurons are indicated with asterisks. (B,D) F59 staining reveals slow muscle cells (green). (A,B) There is a single DRG per somite in most segments, although one segment (open arrowhead) has two DRG neuron clusters. (C,D) Adaxial cells were removed from the experimental side and F59 staining shows less slow muscle. In many segments there are two DRG neuron clusters per somite; the second cluster is often much further ventral than the normal DRG position (arrowheads in C). (E,F) Schematic showing DRG formation in somites 3-10 of five embryos from which adaxial cells were removed from somites on one side; each color represents a different embryo. (E) Control side. (F) Experimental side; the colored lines represent the somites with reduced or missing slow muscle. Scale bar: 20 µm.