
|
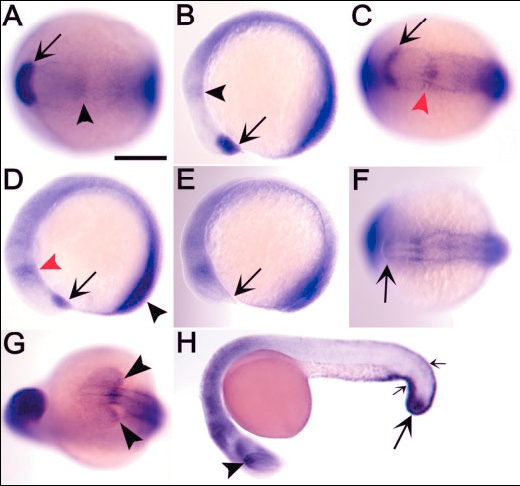
Fig. 3 Expression of zebrafish tcf7 during somitogenesis. A,B: The five-somite stage. Arrows indicate expression in prechordal plate, and arrowheads indicate expression in diencephalon/mesencephalon boundary. A: Dorsal view, anterior to left. B: Lateral view, anterior to left. C,D: The eight-somite stage. Specific expression seen in diencephalon/mesencephalon boundary (red arrowheads), polster (arrows), and tail bud (black arrowhead). C: Dorsal view, anterior to left. D: Lateral view, anterior to left. E,F: The 12-somite stage. Expression of tcf7 is absent in polster (arrows). E: Lateral view, anterior to left. F: Dorsal view, anterior to left. G: The 15-somite stage showing expression in dorsal retina (arrowheads). Frontal view. H: Embryo at 24 hr postfertilization (hpf) showing expression in dorsal retina (arrowhead), tail bud (large arrow), and median fin fold (small arrows). Lateral view, anterior to left. Scale bar in A = 300 μm in A-G, 500 μm in H.