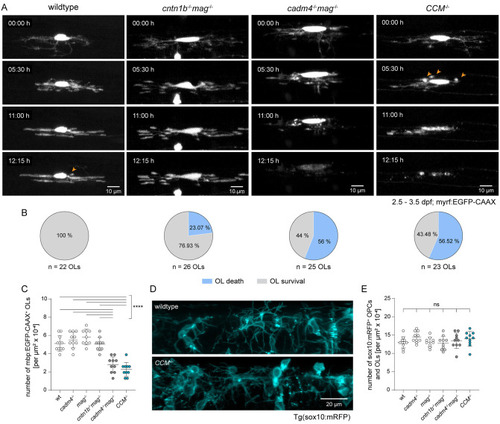
Loss of Cadm4, Cntn1b, and Mag leads to impaired formation and stability of nascent myelin sheaths and cell death of early myelinating OLs.
(A) Selected frames from confocal time-lapse recording show survival or cell death of individual myrf:EGFP-CAAX-expressing, newly differentiated OLs in wild type, cntn1b−/−mag−/− dKO, cadm4−/−mag−/− dKO, and CCM−/− tKO, imaged over 13 hours between 2.5 and 3.5 dpf. Scalebar is 10 µm. Maximum intensity projections shown. (B) Quantification of the percentage of labeled OLs undergoing cell death was analyzed from the time-lapse recording, referred to in (A). Data were collected from 10 fish for wild type, 7 fish for cntn1b−/−mag−/− dKO, 8 fish for cadm4−/−mag−/− dKO, and 8 fish for CCM−/− tKO. (C) Quantification of the number of mbp:EGFP-CAAX-expressing myelinating OLs per µm2 in the zebrafish dorsal hemi-spinal cord. (D) Confocal images of the lateral view of wild-type and CCM−/− tKO zebrafish dorsal spinal cord at 4 dpf, where OPCs and newly-differentiated oligodendrocytes are labeled with the transgenic reporter line Tg(sox10:mRFP). Images were cropped to exclude myelin-dense regions. Scalebar is 20 µm. (E) Quantification of the number of sox10:mRFP-expressing OPCs and newly-differentiated myelinating OLs per µm2 in the zebrafish hemi-spinal cord, as identified in (D). Data was collected from a total of 21–26 individual OLs, sampled from 8 to 10 fish (B) and 9–10 fish (C and E) per genotype. Graphs indicate mean values ± SD, analyzed by one-way ANOVA with Tukey’s multiple comparisons test (C and E). ns, non-significant, ****p < 0.0001. The data underlying this Figure can be found in S1 Data.
|
