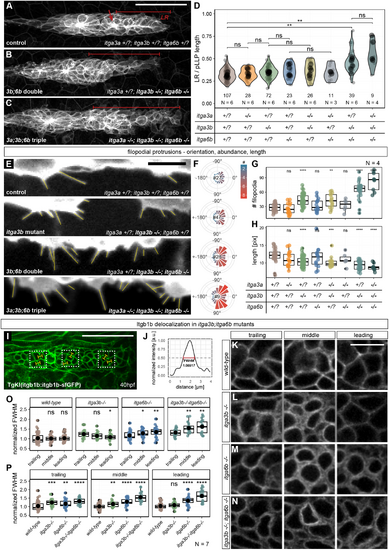
pLLP cell behavior and Itgb1b localization are altered in α3- and α6b-integrin mutants. (A-C) Maximum-intensity projections of pLLPs in sibling control (A), itga3b;itga6b double (B) and itga3a;itga3b;itga6b triple (C) mutants at 40 hpf (live). The leading region (LR) extends from the pLLP tip to the first rosette (red arrow). (D) Quantification of the ratio LR/total pLLP length. (E) Single z-plane higher magnification views of pLLP filopodia (translucent lines), as quantified in F-H. (F) Mean filopodia number per angular bin; 0° is the direction of migration. (G,H) Total filopodia counts (G) and mean length (H) compared across genotypes. (I,J) Quantification approach of the full-width at half-maximum (FWHM) based on signal intensity profiles (J) measured on segments (yellow in I) perpendicular to pLLP cell membranes in TgKI(itgb1b:itgb1b-sfGFP) pLLP (I). (K-N) itgb1b-sfGFP delocalization in itga3b;itga6b mutants at 40 hpf. (O,P) Quantification of itgb1b-sfGFP FWHM. Data are grouped by (O) genotype or (P) region for statistical comparison. (D) Pairwise Wilcoxon rank-sum tests on per-experiment means. (G,H,O,P) Two-tailed Wilcoxon test ([boxes indicate the median and interquartile range (IQR); whiskers indicate 1.5×IQR]). ns, non-significant. *P<0.05; **P<0.01; ***P<0.001; ****P<0.0001. Scale bars: 50 μm in A-C,I; 10 μm in E,K-N.
|
