
FIGURE 1
- ID
- ZDB-FIG-260612-14
- Publication
- Frick et al., 2026 - Virtual Screening and Zebrafish Phenotype-Based Evaluation Argues Against Repurposing 4-Phenylbutyrate for STXBP1-Related Disorders
- Other Figures
- All Figure Page
- Back to All Figure Page
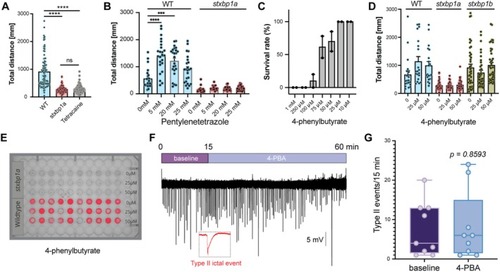
Movement deficit and response to 4‐PBA in stxbp1 mutant larvae. (A) Bar plots of total distance traveled during a 10 min tracking epoch. Data are shown for age‐matched WT, stxbp1a−/− in normal embryo media (stxbp1a) and stxbp1a−/− in normal embryo media with tetracaine (tetracaine) larvae. Data is shown as mean ± S.E.M. ****significance p < 0.0001, one‐way ANOVA. (B) Bar plots of total distance traveled during a 10 min tracking epoch. Data are shown for stxbp1a−/− and WT larvae exposed to pentylenetetrazole. Data is shown as mean ± S.E.M. Significant differences are denoted as ****p ≤ 0.0001, ***p ≤ 0.001, **p ≤ 0.01. One‐way ANOVA with Dunnett's multiple comparison test. (C) Bar plot of the percent of live, healthy WT larvae following exposure to 4‐phenylbutyrate for 48 h. Note that 100% of larvae survive exposures at 10 and 25 μM. N = 20–40 fish for each condition. (D) Bar plots of total distance traveled during a 10 min tracking epoch. Data are shown for age‐matched WT, stxbp1b−/−, and stxbp1a−/− larvae exposed to normal embryo media (0) or 4‐phenylbutyrate at 10 and 25 μM. N = 20–30 fish in each concentration with 2–3 replicates (E) Representation of cumulative tracking of the spontaneous locomotion of 5 dpf WT and stxbp1a mutant larvae for 20 min after 48 h of incubation in 4‐PBA. Each well represents an individual fish. Movement is shown in red. (F) Representative 60‐min local field potential (LFP) trace for stxbp1b mutant zebrafish at baseline (0–15 min) and continuous bath exposure to 50 μM 4‐PBA (45–60). The inset shows a high‐resolution image of a typical Type II ictal‐like seizure event. Significance p = 0.8593, Unpaired t test; 95% confidence interval (CI) = −7.18 to 8.51. Individual value plot of ictal event frequency measured at baseline (0–15 min) and 45–60 min after continuous bath application of 4‐PBA. |
| Fish: | |
|---|---|
| Conditions: | |
| Observed In: | |
| Stage: | Day 5 |