
Figure 5
- ID
- ZDB-FIG-260608-5
- Publication
- Li et al., 2026 - TRIM25 enhances hypoxia signaling by catalyzing K11-linked polyubiquitination and stabilization of HIF-α
- Other Figures
- All Figure Page
- Back to All Figure Page
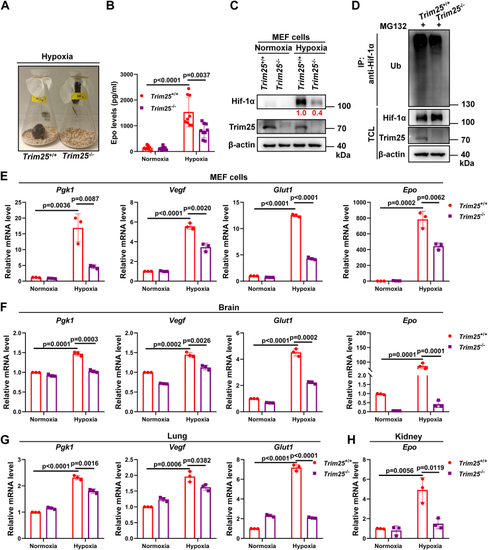
Disruption of Trim25 in mice attenuates hypoxia tolerance.A, images of Trim25+/+ and Trim25−/− mice (8 weeks) exposed to hypoxia (10% O2) for 2 h. B, ELISA of Epo in serum from Trim25+/+ and Trim25−/− mice (n = 9 per group) exposed to normoxia (21% O2) or hypoxia (10% O2) for 4 h. C, IB of endogenous Hif-1α in Trim25+/+ or Trim25−/− MEF cells cultured under normoxia (21% O2) or hypoxia (1% O2) for 4 h. D, IB of endogenous Hif-1α ubiquitination in Trim25+/+ or Trim25−/− MEF cells treated with MG132 (20 μM) and cultured under hypoxia (1% O2) for 4 h. E, qPCR analysis of Pgk1, Vegf, Glut1, and Epo mRNA in Trim25+/+ or Trim25−/− MEF cells cultured under normoxia (21% O2) or hypoxia (1% O2) for 16 h. F, qPCR analysis of Pgk1, Vegf, Glut1, and Epo mRNA in the brain of Trim25+/+ or Trim25−/− mice under normoxia (21% O2) or hypoxia (10% O2) for 4 h. G, qPCR analysis of Pgk1, Vegf and, Glut1 mRNA in the lungs of Trim25+/+ or Trim25−/− mice under normoxia (21% O2) or hypoxia (10% O2) for 4 h. H, qPCR analysis of Epo mRNA in the kidney of Trim25+/+ or Trim25−/− mice under normoxia (21% O2) or hypoxia (10% O2) for 4 h. Data in (B, E–H) are shown as mean ± SD; statistical significance was determined by unpaired two-tailed Student’s t test; each point represents a technical replicate of a representative experiment from three independent experiments in (E–H). |