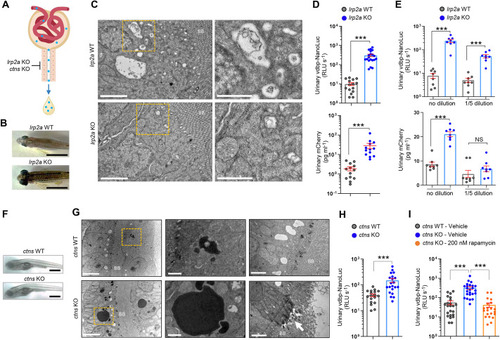
Validation of the bioluminescent vdbp-NanoLuc reporter system in genetic models. (A) Schematic illustration of genetic models of PT dysfunction caused by inactivation of megalin receptor [lrp2a knockout (KO)] or deficiency of lysosomal cystine transporter cystinosin (ctns KO). (B) Dorsal view showing enlarged eye globes in lrp2a KO adult zebrafish. Scale bars: 1 cm. (C) Transmission electron microscopy illustrating the loss of endocytic vesicles in the PT of lrp2a KO zebrafish larvae. Yellow dashed line squares contain images at higher magnification. n=5. BB, brush border. Scale bars: 2 µm (left column), 1 µm (right column). (D) Overnight urine was collected from lrp2a WT and lrp2a KO ½vdbp-NanoLuc or ½vdbp-mCherry zebrafish larvae at 5 dpf, and analyzed by luminometric assay or mCherry enzyme-linked immunosorbent assay (ELISA). ½vdbp-NanoLuc, n=15 (lrp2a WT) and n=20 (lrp2a KO); ½vdbp-mCherry: n=13. (E) Transgenic lrp2a mutant ½vdbp-NanoLuc zebrafish were crossed with lrp2a mutant ½vdbp-mCherry zebrafish to produce double-transgenic lrp2a KO larvae expressing both VDBP tracers. Urine samples were collected and analyzed without dilution (no dilution) or after 5× dilution in E3 medium (1/5 dilution) for both VDBP reporter proteins in the same urine sample. After 5× dilution, the urinary NanoLuc luciferase activity in lrp2a KO larvae was still significantly higher than that in lrp2a WT larvae, whereas no difference was observed between the two groups when urine samples were analyzed by mCherry ELISA. n=8. (F) Morphology of ctns KO larvae at 14 dpf. Scale bars: 1 mm. (G) Representative micrographs showing electron-dense vesicles and sporadic loss of brush border in the PT epithelial cells of ctns KO larvae at 14 dpf. n=5. Yellow dashed line squares contain images at a higher magnification. Arrow indicates loss of brush border. Scale bars: 5 µm (left column), 1 µm (middle column) and 2 µm (right column). (H) Quantification of vdbp-NanoLuc luciferase activity in urine samples obtained from 14 dpf ctns WT and ctns KO ½vdbp-NanoLuc zebrafish larvae. n=18 (ctns WT) and n=21 (ctns KO). Urinary vdbp-NanoLuc was slightly increased in transgenic ctns WT larvae at baseline when kept in fish facility water and under feeding. (I) ctns KO ½vdbp-NanoLuc larvae were treated with fish facility water containing vehicle or 200 nM rapamycin, followed by assessment of urinary vdbp-NanoLuc at 14 dpf. n=23 (ctns WT-vehicle), n=24 (ctns KO-vehicle) and n=21 (ctns KO-rapamycin). Plotted data represent mean±s.e.m. Nonparametric Mann–Whitney test, ***P<0.001 relative to lrp2a WT or ctns WT. NS, non-significant.
|
