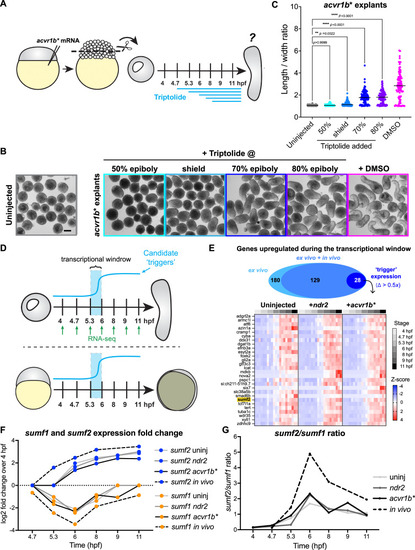
Ex vivo convergence & extension requires new transcription at gastrulation onset.
A Diagram of zebrafish embryonic explants and Triptolide treatments (modified from36). All explants were generated from WT embryos of the AB background. B Representative images of uninjected and acvr1b* explants at 12 hpf (equivalent of 4-somite stage) after treatment with triptolide at the indicated stages or with DMSO at 50% epiboly. Scale bar = 200 μm. C Length/width ratios of explants shown in (B). Each dot represents a single explant from three independent trials, black bars are median values; p < 0.0001, two-sided Mann-Whitney test. D Overview of comparisons between published bulk RNA-sequencing experiments from seven developmental stages in three explant conditions (uninjected, acvr1b*, and ndr2) (top) and intact embryos (bottom). Candidate trigger genes were strongly upregulated within the previously determined transcriptional window (5.3–6 hpf). E (Top) 180 genes exhibited ‘trigger’ expression patterns in all explant conditions (light blue); of these, 129 were also upregulated in intact embryos (blue), and 28 showed a sharp increase (Δ > 0.5x) with significant expression levels in intact embryos ( > 5 TPM, dark blue). (Bottom) Heatmap of candidate trigger genes in uninjected, acvr1b*, and ndr2 explants. sumf2 (highlighted in yellow) was selected for further study. F Fold-change expression of sumf1 and sumf2 transcripts over 4 hpf in explants (solid lines) and embryos (dashed lines) over time. G sumf2/sumf1 expression ratio in explants (solid line) and embryos (dashed line) over time. Note the peak in the sumf2/sumf1 ratio at 6 hpf, coinciding with the previously determined transcriptional window. Source data are provided as a Source Data file.
|
