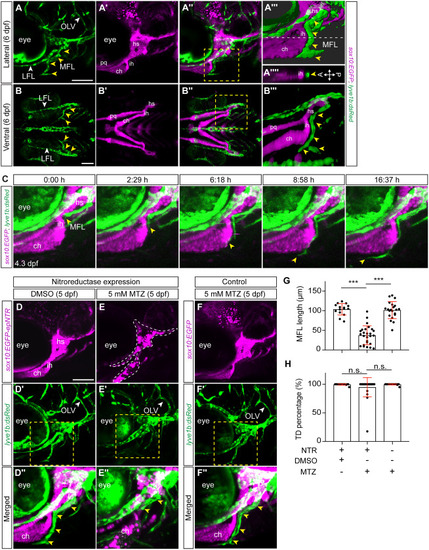
Hyoid cartilage is required for MFL development (A and B) Confocal images of the lateral (A) and ventral (B) head at 6 dpf in lyve1b:dsRed (green) sox10:EGFP (magenta) larvae. The MFL (yellow arrowheads) aligns with the hyosymplectic (hs) interhyal (ih), and ceratohyal (ch) cartilages. (A‴–B‴) 3D images taken from areas highlighted by the yellow dashed boxes in (A″– B″). (A⁗) An XZ view from the dotted line in (A″) shows the alignment of the MFL near the interhyal cartilage. (C) Still images taken from confocal time-lapse imaging of MFL development in lyve1b:dsRed (green) sox10:EGFP (magenta) larvae from 4.3 to 5 dpf (16.37 h) (Video S2). Yellow arrowheads point to the tip of the developing MFL. (D–F) Confocal images of the zebrafish head at 5 dpf, comparing cartilage (magenta) (D–F) and lymphatic (green) (D′–F′) phenotypes between lyve1b:dsRed; sox10: EGFP-epNTR larvae treated at 3.5 dpf with DMSO (D) or 5 mM MTZ (E), and control lyve1b:dsRed; sox10:EGFP larvae treated at 3.5 dpf with 5 mM MTZ (F). (D″–F″) Magnified image regions are highlighted by the yellow dashed boxes in (D′)–(F′). The dashed outline in (E) highlights hyoid cartilages with ablated chondrocytes and the yellow arrowheads in (D″)–(F″) highlight the MFL. Note the underdeveloped MFL associated with cartilage ablation (E–E″). (G and H) Quantification of the length of the MFL (G) and the formation of TD (H) at 5 dpf, comparing the DMSO group (n = 15) with the MTZ-treated group (n = 26) and the MTZ-treated control group (n = 21). ch, ceratohyal; hs, hyosymplectic; ih, interhyal; LFL, lateral facial lymphatic vessel; MFL, medial facial lymphatic vessel; MTZ, metronidazole; OLV, otolithic lymphatic vessel; TD, thoracic duct. Scale bars: 50 μm. Data represent mean ± SD; ∗∗∗p < 0.001; ns, p > 0.05 from one-way ANOVA with Dunnett’s multiple comparison tests for the assessment of significance.
|
