|
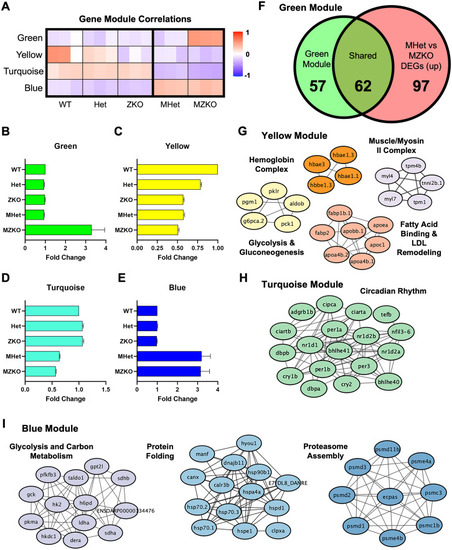
Expression signatures derived from maternal and zygotic genotypes. A: Heat map of modules identified through weighted gene co-expression network analysis that were highly correlated with either the maternal or zygotic genotype at 5 dpf. B–E: Fold change of normalized expression in each module across genotypes compared to the WT samples as validation of gene module correlations. F: Overlap of genes within the green module and upregulated DEGs in MZKOs compared to their MHet siblings at 5 dpf shown in Fig 7C. G: STRING analysis of genes within the yellow module showing interacting networks of proteins involved in fatty acid binding and LDL remodeling, glycolysis and gluconeogenesis, the myosin II complex and the hemoglobin complex. H: STRING analysis of genes within the turquoise module showing an interacting network of proteins involved in circadian rhythm regulation. I: STRING analysis of genes within the blue module showing interacting networks of proteins involved in processes such as protein folding, carbon metabolism, and proteasome assembly.
|