FIGURE

Figure 11

ID
ZDB-FIG-251031-194
Publication
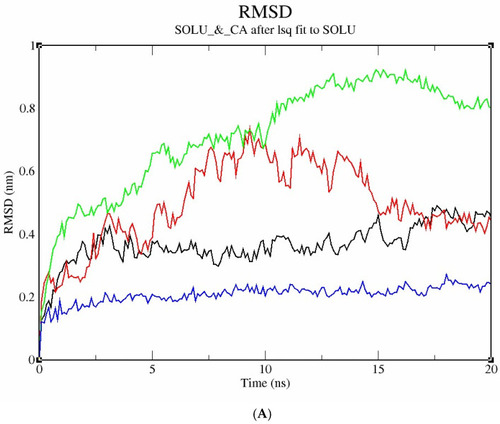
Kumari et al., 2025 - Evaluating the Molecular Basis of Nanocalcium-Induced Health Regulation in Zebra Fish (Danio rerio)
Other Figures
All Figure Page
Back to All Figure Page
Figure 11

(A) Graphical representation of molecular dynamic study for modelled protein stability shown through RMSD profile of the modelled protein structures. The colour index used to represent the different protein structures is acetylcholinesterase, shown in black; catalase in red; dopamine in green; and glycogen in blue. (B) Graphical representation of molecular dynamic study for modelled protein stability showing radius of gyration of the modelled protein structures. The colour index used to represent the different protein structures is acetylcholinesterase in black, catalase in red, dopamine in green, and glycogen in blue. (C) Graphical representation of molecular dynamic study for modelled protein stability showing RMS deviation of the modelled protein structures. The colour index used to represent the different protein structures is acetylcholinesterase in black, catalase in red, dopamine in green, and glycogen in blue.

Expression Data

Expression Detail
Antibody Labeling
Phenotype Data

Phenotype Detail
Acknowledgments
This image is the copyrighted work of the attributed author or publisher, and ZFIN has permission only to display this image to its users. Additional permissions should be obtained from the applicable author or publisher of the image. Full text @ Bioengineering (Basel)