
Fig. 7
- ID
- ZDB-FIG-250813-28
- Publication
- Halford et al., 2025 - TMEM63A, associated with hypomyelinating leukodystrophies, is an evolutionarily conserved regulator of myelination
- Other Figures
- All Figure Page
- Back to All Figure Page
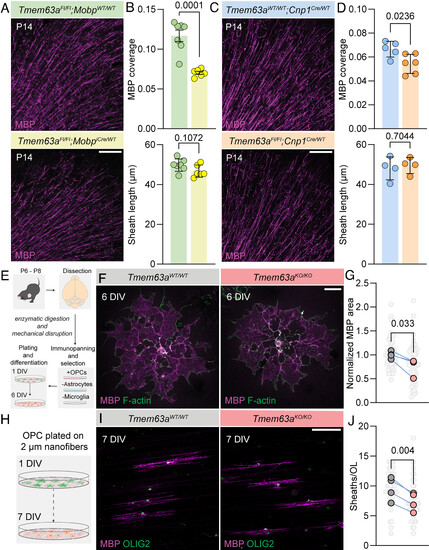
TMEM63A functions cell autonomously in OLs. (A) Representative micrographs of 50 µm-thick cortical sections immunostained against MBP (magenta) from P14 Tmem63aFl/Fl; MobpWT/WT and Tmem63aFl/Fl; MobpiCre/WT mice. (Scale bar, 100 µm.) (B) Top, MBP coverage in cortical sections, as determined by MBP+ area divided by total imaged area, for P14 Tmem63aFl/Fl; MobpWT/WT and Tmem63aFl/Fl; MobpiCre/WT mice (n = 7 animals, unpaired t test). Bottom, Internode myelin sheath lengths for P14 Tmem63aFl/Fl; MobpWT/WT and Tmem63aFl/Fl; MobpiCre/WT mice (n = 7 animals, unpaired t test). (C) Representative micrographs of 50 µm-thick cortical sections immunostained against MBP (magenta) from P14 Tmem63aWT/WT; Cnp1Cre/WT and Tmem63aFl/Fl; Cnp1Cre/WT mice. (Scale bar, 100 µm.) (D) Top, MBP coverage in cortical sections, as MBP+ area by total imaged area, for P14 Tmem63aWT/WT; Cnp1Cre/WT and Tmem63aFl/Fl; Cnp1Cre/WT mice. (n = 5 to 6 animals per genotype, unpaired t test). Bottom, internode myelin sheath lengths for P14 Tmem63aWT/WT; Cnp1Cre/WT (blue) and Tmem63aFl/Fl; Cnp1Cre/WT (orange) mice. (n = 4 animals per genotype, unpaired t test). (E) Schematic for OL isolation and culture. After plating as OPCs, cells were differentiated for 6 d in vitro (DIV) before immunostaining. (F) Representative micrograph of OLs isolated from Tmem63aWT/WT and Tmem63aKO/KO mice, stained with MBP (magenta) and phalloidin for F-actin (green). (Scale bar, 25 µm.) (G) MBP+ area, normalized to average of WT cultures. Individual cells in light gray, culture averages in gray (Tmem63aWT/WT) and rose (Tmem63aKO/KO) (n = 4 cultures per genotype, paired t test). (H) Using the same protocol as indicated in (E), OPCs were plated on 2 µm nanofibers and differentiated for 7 DIV. (I) Representative micrograph of OLs isolated from Tmem63aWT/WT and Tmem63aKO/KO mice and plated on nanofibers, stained with MBP (magenta) and OLIG2 (green). (Scale bar, 25 µm.) (J) Quantification of average sheath number per cell. Individual cells in light gray, culture averages in gray (Tmem63aWT/WT) and rose (Tmem63aKO/KO) (n = 4 animals each genotype, paired t test). |