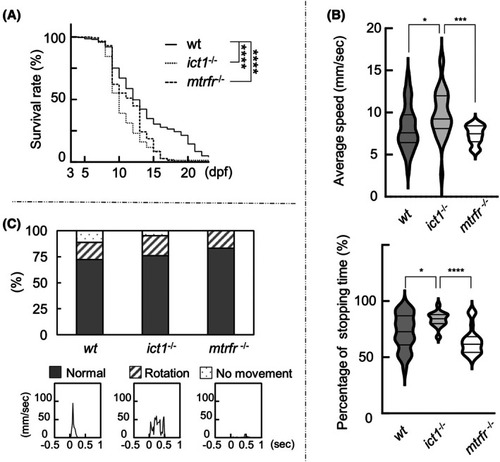
Survival rates and motor behaviors of larvae of the wild‐type, ict1−/−, and mtrfr−/−. (A) Kaplan–Meier survival curves of the wild‐type (n = 201), ict1−/− (205), and mtrfr−/− (145) reared in Petri dishes without feed. The observations were initiated on 3 dpf. Asterisks indicate significant differences between individual groups (Kruskal–Wallis test with Dunn's multiple comparisons test). ****P < 0.0001; ***P < 0.001; **P < 0.01; *P < 0.05. (B) Upper: Average speed at which the larvae of the three lines were moving, calculated by dividing the distance traveled by the time spent traveling. Violin plots show the average speed of the 7 dpf larvae of the wild‐type (n = 29), ict1−/− (30), and mtrfr−/− (24). Calculation of the travel time does not include frames in which the larvae ceased their travel (i.e., travel distance < 0.02 mm). The third quartile, the median, and the first quartile are indicated by horizontal bars from top to bottom. Data were assessed using the Kruskal–Wallis test with Dunn's multiple comparisons test. Movement trajectories of the larvae are shown in Fig. S4B. Bottom: Percentage of stopping time during which the larvae ceased to travel, calculated by dividing the time during which the larvae ceased their travel (i.e., travel distance < 0.02 mm) by the total recording time. (C) Upper: Percentage of three types of touch response to the 7 dpf larvae of the three lines classified into normal, rotation, and no movement. Bottom: a typical plot (seconds vs. speed) for each category is shown. A more detailed illustration of the classification is shown in Fig. S4C. No significant differences between wt and ict1−/− (Fisher's exact test, P = 0.764) or between wt and mtrfr−/− (P = 0.703) were observed.
|
