
Fig. 2
- ID
- ZDB-FIG-250624-2
- Publication
- Imai et al., 2025 - Real-time imaging of blood coagulation and angiogenesis during development in a zebrafish model of type I antithrombin deficiency
- Other Figures
- All Figure Page
- Back to All Figure Page
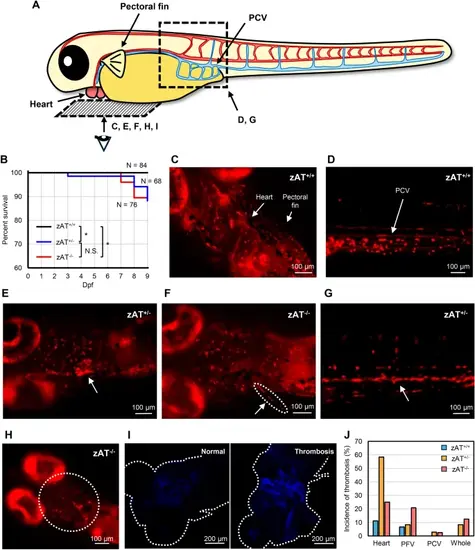
Survival curves and thrombosis sites of zAT mutants. (A) Illustration of a juvenile zebrafish. Arteries are shown in red and veins in blue. The dotted rectangular area and the alphabet correspond to the multipanel figures in Fig. 2. The locations of the heart, pectoral fin, and PCV are indicated by arrows. The positioning of the blood vessels and heart was based on previous studies by Lee et al.45. (B) Comparative survival rates between zAT+/+ zebrafish and zAT+/− or zAT−/− zebrafish, illustrating survival differences across genotypes. The sample sizes are N = 84, 68, and 76 for zAT+/+, zAT+/−, and zAT−/− zebrafish, respectively. N.S., not significant; *p < 0.05. The survival rates for zAT+/+, zAT+/−, and zAT−/− zebrafish on the 9dpf were 100%, 88.24%, 88.16%, respectively. (C, D) Fluorescent images of erythrocytes in zAT+/+ zebrafish, focusing on the heart, pectoral fin vessel (PFV), and posterior cardinal vein (PCV). (E–H) Fluorescence imaging depicting thrombosis in zAT mutant zebrafish. Red fluorescence represents erythrocytes. White arrows or areas circled by white dotted lines indicate thrombus locations in the heart (E), pectoral fin (F), and PCV (G). An instance of a beating heart with restricted systemic blood flow is shown in (H). (I) Immunofluorescence staining of juvenile zebrafish displaying the same symptoms as in (H), using an anti-fibrin antibody, with blue fluorescence indicating fibrin. The zebrafish is outlined with a white dotted line. (J) Incidence of thrombosis in the heart, PFV, PCV, and systemic circulation corresponding to (E–H), respectively. Sample sizes for heart, PFV, and systemic are N = 45 for zAT+/+ zebrafish, N = 12 for zAT+/− zebrafish, and N = 24 for zAT−/− zebrafish. The number of samples for PCV is N = 45 for zAT+/+ zebrafish, N = 35 for zAT+/− zebrafish, and N = 40 for zAT−/− zebrafish. |