
Fig. 1
- ID
- ZDB-FIG-250523-26
- Publication
- Nayak et al., 2025 - Transcriptome profiling of tendon fibroblasts at the onset of embryonic muscle contraction reveals novel force-responsive genes
- Other Figures
- All Figure Page
- Back to All Figure Page
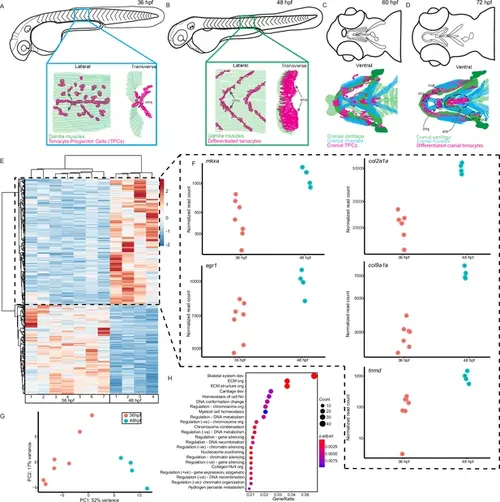
Onset of embryonic muscle contraction regulates transcription in tenocytes. (A–D) Diagrams depicting changes in tenocyte distribution and morphology during onset of trunk and cranial muscle contractions, (A) 36 hpf when twitching movements are sporadic and (B) 48 hpf when embryos become free swimming. Lateral views of 36 (A) and 48 hpf embryos (B). Insets show lateral and transverse views of migrating tenocyte progenitors (A) and differentiated tenocytes at somite boundaries with polarized, branched projections (B). Ventral views of the embryonic head in 60 hpf (C) and 72 hpf (D) embryos just prior to and during the onset of jaw movements. Cartilage (green), tenocytes (magenta), and muscles (cyan) showing tenocyte elongation, particularly in the sternohyoid tendon (sht) and condensation, as well as the mandibulohyoid junction (mhj). (E) Heatmaps from bulk RNA-sequencing (RNA-seq) showing the top 1000 differentially expressed genes (DEGs) between 36 and 48 hpf. p < 0.05. (F) Elevated expression of tenocyte marker genes mkxa, tnmd, and egr1 and extracellular matrix (ECM) genes col2a1a, col9a1a in RNA-seq experiments at 48 hpf. Datapoints represent normalized read counts of single biological replicates at each color-coded timepoint (n = 7 for 36 hpf, n = 4 for 48 hpf). (G) Elevated expression of cartilage marker genes col2a1a and col9a1a in 48 hpf samples. (H) PCA of individual replicates showing separation of experimental conditions by timepoint. (I) GO analysis using Biological Process (BP) terms of top 2788 DEGs by adjusted p-value. |