
Fig. 1
- ID
- ZDB-FIG-250505-69
- Publication
- Yang et al., 2025 - The Serotonergic Dorsal Raphe Promotes Emergence from Propofol Anesthesia in Zebrafish
- Other Figures
- All Figure Page
- Back to All Figure Page
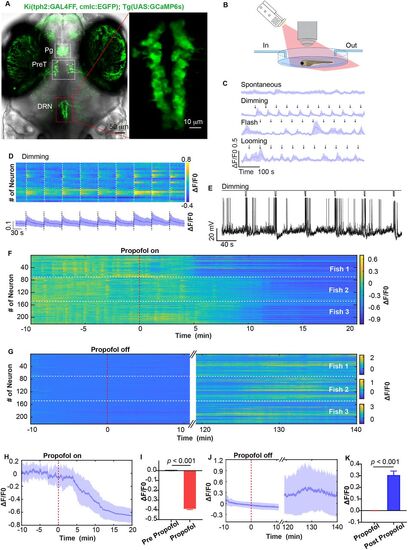
Calcium activity of DRN5-HT neurons were suppressed by propofol. A, The tph2 knock-in mutant line Ki(tph2:GAL4FF,cmlc2:EGFP);Tg(UAS:GCaMP6s) marks 5-HT neuron at pineal gland (Pg), pretectum (PreT), and DRN. B, Propofol was perfused and eluted during in vivo calcium imaging at single cellular resolution, accompanied by visual stimuli by a projector. C, Spontaneous calcium activity of DRN5-HT and calcium activity responded to dimming, flash and looming stimuli. Data represent mean ± SEM. n = 3 larvae. D, Representative calcium activity stimulated by dimming at 58 s interval (top) and the mean trace (bottom) from a layer of DRN5-HT. The dash line indicates dimming stimulation. Data represent mean ± SEM. E, In vivo whole-cell electrophysiology showed not that dimming stimuli did not influence the membrane potential of DRN5-HT. F,G, Heatmaps of calcium activity during perfusion and elution of propofol from 221 DRN5-HT neuron of three larvae. The slow recovery of neural activity is attributed to the slow perfusion speed (1.66 ml/min) to ensure imaging stability and potential quenching of GCaMP6s fluorescence signal over long imaging periods (Extended Data Fig. 1-1). H,I, Calcium events were significantly inhibited by 30 µM propofol perfusion. H, mean ± SEM, indicated by the full line and shaded area. I, Pre-propofol versus propofol; 0 versus −0.390 ± 0.007; p < 0.001; paired t test. J,K, Calcium activity recovered after propofol was eluted. J, Mean ± SEM, indicated by the full line and shaded area. K, Propofol versus post-propofol, 0 versus 0.305 ± 0.035; p < 0.001; paired t test. |