
Fig. 4
- ID
- ZDB-FIG-250425-21
- Publication
- Oh et al., 2025 - SMC2 and Condensin II Subunits Are Essential for the Development of Hematopoietic Stem and Progenitor Cells in Zebrafish
- Other Figures
- All Figure Page
- Back to All Figure Page
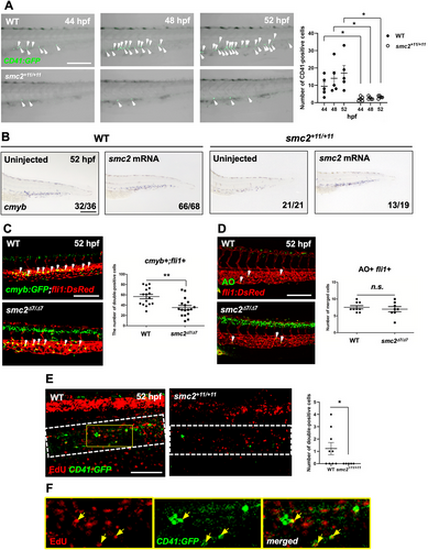
Smc2 is required for HSPC proliferation in the CHT. (A) Confocal imaging of smc2 mutant embryos and sibling controls with a CD41:GFP transgenic background at 44, 48, and 52 hpf. Right panel: quantification of CD41-positive HSPCs in the CHT (WT at 44 hpf, n = 5; mutants at 44 hpf, n = 5; WT at 48 hpf, n = 5; mutants at 48 hpf, n = 5; WT at 52 hpf, n = 5; mutants at 52 hpf, n = 5; *p < 0.05). White arrows indicate CD41-positive HSPCs. Data from a single experiment. (B) WISH of smc2 mutant embryos and WT controls at 52 hpf following injection with smc2 mRNA. Black square brackets indicate the cmyb signal in the CHT. The numbers shown at the bottom of the images represent the count of representative outcomes observed relative to the total number of embryos obtained. Data from two independent experiments. (C) Confocal microscopy images of smc2 mutant embryos and their sibling controls in the cmyb:GFP;fli1:DsRed background. White arrows indicate HSPCs. Right panel: quantification of cmyb+;fli1+ cells in the CHT at 52 hpf (WT, n = 16; mutants, n = 17; **p < 0.01). Data from a single experiment. (D) Confocal imaging of smc2 mutant embryos and WT controls at 52 hpf with acridine orange (AO) staining using fli1:DsRed transgenic zebrafish embryos. White arrows indicate AO-positive apoptotic cells. Right panel: quantification of AO+;fli1+ cells in the CHT (WT, n = 8; mutants, n = 8; n.s., no significance at p > 0.05). Data from a single experiment. (E) Confocal microscopy imaging of EdU-stained (incorporating 24 h) smc2 mutant embryos and WT sibling controls in the background of CD41:GFP at 52 hpf. White-dotted box indicates CHT. Right panel: quantification of EdU- and CD41-double positive cells in the CHT (WT, n = 9; mutants, n = 5; *p < 0.05). The results represent data from two independent experiments. (F) Higher magnification images of the yellow box in EdU-stained WT;CD41:GFP transgenic zebrafish embryos from (E). Yellow arrows indicate EdU- and CD41-double positive cells in the CHT. All quantification data were quantified and expressed as the mean ± SEM. Statistical analysis was performed using a t-test to calculate p-values. Scale bar = 200 μm. |