
Fig. 2
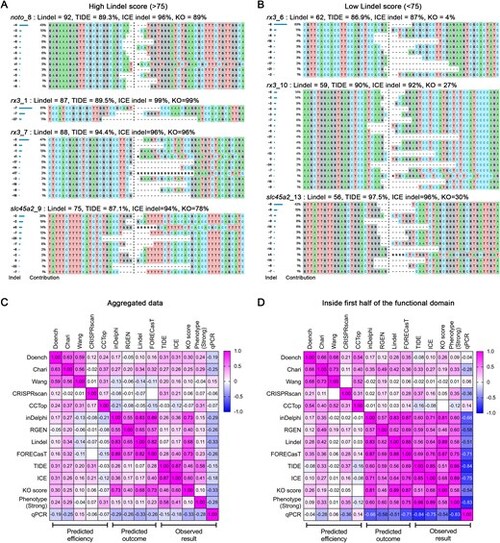
Predicted versus observed knockout efficiency correlations and Indel distributions across gRNAs. Synthego ICE analysis showing indel distributions for each gRNA scoring >75 in Lindel shown in (A) and those scoring <75 shown in (B). Panels (C) and (D) present heatmap visualizations of Pearson correlations between observed results and various prediction tools, including editing efficiency (TIDE and ICE), knockout (KO) score, strong phenotype penetrance, and RT-qPCR. Panel (C) summarizes aggregated data, while panel (D) focuses on gRNAs targeting the first half of the functional domain. Positive correlations (Pearson coefficient r > 0) are shown in magenta, while negative correlations (r < 0) are displayed in blue. |