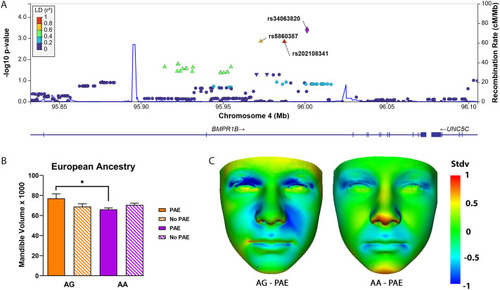
Association of jaw deformations with single nucleotide polymorphisms (SNPs) located within BMPR1B in the European ‘look-up’ resource. (A) The y-axis denotes the −log10 (P-value) for the genotype×PAE effect for association with mandible volume (triangles). Indicated on the x-axis is the physical position on the chromosome (Mb). The extent of linkage disequilibrium (LD) (as measured by r2) in the 1000 Genomes European reference panel between each SNP (triangles) and the purple diamond SNP is indicated by the color scale at the top left. Larger values of r2 indicate a greater LD. rs34063820, the SNP with the highest P-value (P=4×10⁻⁴) in BMPR1B, is indicated by a purple diamond. Two SNPs in LD with rs34063820 are also associated with mandible volume, i.e. rs202108341, P=8×10⁻³ (red triangle) and rs5860387, P=8×10⁻³ (yellow triangle). (B) Mandible volume in children of European ancestry (EA) with or without prenatal alcohol exposure (PAE and No PAE, respectively) according to genotype. In individuals with AA genotype, the mandible volume was significantly decreased (*P=0.032) in PAE vs No PAE individuals with the AG genotype. (C) Dense surface model (DSM) analysis of facial signature heatmaps, indicating surface to normal displacement at ±1 standard deviation (Stdv) for mean No PAE age-matched individuals of EA, where red-blue-green coloring indicates a reduction-expansion or agreement compared to the normalized group. Left: AG genotype with PAE (n=10). Right: AA genotype with PAE (n=83), both normalized against all EA age-matched individuals (AG+AA genotype) without PAE (n=35). Red coloring on the mandible tip indicates a mandibular retraction or micrognathia.
|
