
Fig. 3
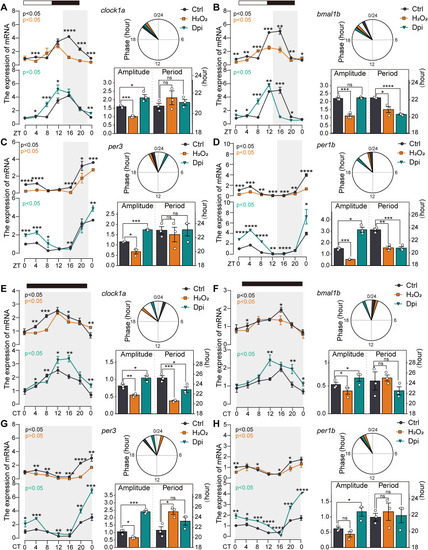
ROS induce dysregulation of core circadian clock genes in zebrafish larvae Under LD (light‒dark) and DD (dark‒dark) conditions, 5 dpf zebrafish larvae (n = 30) were treated with different drugs for 3 h, and RNA samples were collected every 4 h for RT‒qPCR analysis of core circadian clock gene expression. (A–D) Effects of ROS treatment on core circadian clock genes (clock1a, bmal1b, per1b, and per3) in zebrafish larvae under LD conditions. (E–H) Effects of ROS treatment on core circadian clock genes under DD conditions. JTK cycle analysis was performed to assess rhythmicity, amplitude, period, and phase changes. Bar scatter plots display period and amplitude data, and pie charts illustrate phase shifts. Each group of experiments was repeated three times. Statistical significance was analysed at each time point via t tests, with significance levels denoted as follows: ns, p > 0.05; ∗, p < 0.05; ∗∗, p < 0.01; ∗∗∗, p < 0.001; ∗∗∗∗, p < 0.0001. |