
Fig. 3
- ID
- ZDB-FIG-250414-88
- Publication
- van Bree et al., 2024 - Development of an orthotopic medulloblastoma zebrafish model for rapid drug testing
- Other Figures
- All Figure Page
- Back to All Figure Page
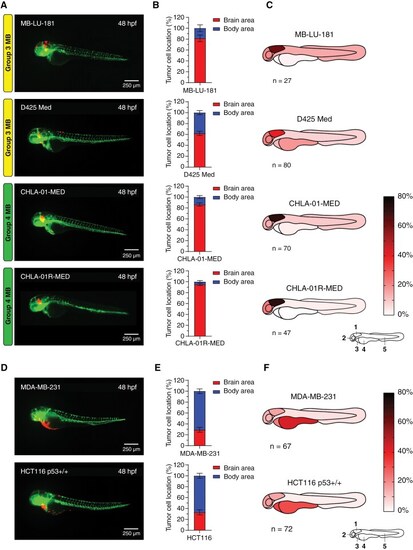
Group 3 and Group 4 medulloblastoma cell lines display homing toward the hindbrain area upon transplantation into the blastula stage of zebrafish embryos whereas non-medulloblastoma cell lines do not. (A) Representative images of fli1:EGFP zebrafish embryos 48 hpf transplanted with Group 3 (MB-LU-181 and D425 Med) and Group 4 (CHLA-01-MED and CHLA-01R-MED) MB cells, (D) and non-MB cell lines (MDA-MB-231 and HCT116 p53+/+). (B) Brain/body area distribution of transplanted Group 3 and Group 4 MB cell lines MB-LU-181 (n = 27), D425 Med (n = 80), CHLA-01-MED (n = 70), and CHLA-01R-MED (n = 47), and (E) non-MB cell lines MDA-MB-231 (n = 67) and HCT116 p53+/+ (n = 72) in 48 h old embryos. Mean ± SEM. (C) Schematic heatmaps of the tumor cell location of Group 3 MB, Group 4 MB, (F) and non-MB cell lines in 48 h old embryos. 1 = hindbrain area; 2 = mid/forebrain area; 3 = pericardium area; 4 = yolk sac area; 5 = body and tail area. |