
FIGURE
Fig. 2
- ID
- ZDB-FIG-250318-91
- Publication
- Liu et al., 2025 - Exploring the distribution and fate of bisphenol A in an aquatic microcosm combined with a multimedia model
- Other Figures
- All Figure Page
- Back to All Figure Page
Fig. 2
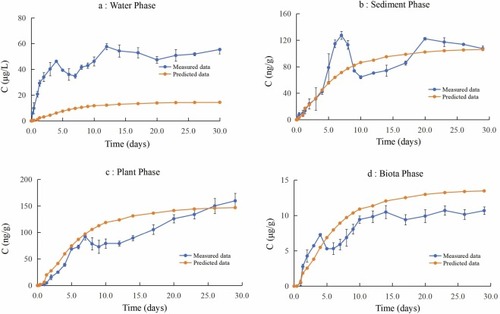
(a–d) Measured (squares and triangles) vs. predicted (dotted line) concentrations of BPA in the aquatic microcosm as a function of time. |
Expression Data
Expression Detail
Antibody Labeling
Phenotype Data
Phenotype Detail
Acknowledgments
This image is the copyrighted work of the attributed author or publisher, and
ZFIN has permission only to display this image to its users.
Additional permissions should be obtained from the applicable author or publisher of the image.
Full text @ Ecotoxicol. Environ. Saf.