
FIGURE
Fig. 4
- ID
- ZDB-FIG-250312-12
- Publication
- Erradhouani et al., 2025 - New insights into the regulation of cyp3a65 expression in transgenic tg(cyp3a65:GFP) zebrafish embryos
- Other Figures
- All Figure Page
- Back to All Figure Page
Fig. 4
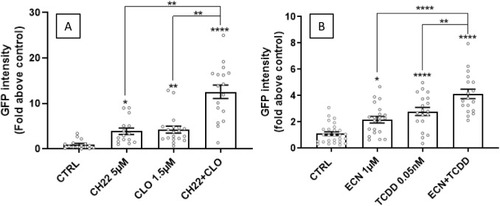
GFP intensity in tg(cyp3a65:GFP) embryos exposed to zfPXR and zfAhR2 agonist and antagonist ligands alone or in combination (n = 21 embryos minimum per condition) at 120 hpf after 48 h. Exposure to CLO 1.5 µM; TCDD 0.05 nM; CH22 5 µM and ECN 1 µM alone or in combination. Control condition (CTRL) is DMSO 0.02%. |
Expression Data
Expression Detail
Antibody Labeling
Phenotype Data
Phenotype Detail
Acknowledgments
This image is the copyrighted work of the attributed author or publisher, and
ZFIN has permission only to display this image to its users.
Additional permissions should be obtained from the applicable author or publisher of the image.
Full text @ Aquat. Toxicol.