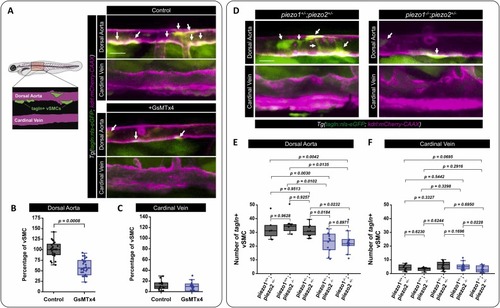
Inhibition of Piezo1 impairs vSMC association with the dorsal aorta in zebrafish. A) Schematic of a 96 hpf zebrafish embryo and the imaging area collected within the zebrafish for analysis. Confocal images of the medial trunk of Tg(tagln:eGFP; kdrl:mCherry-CAAX) zebrafish treated with 50 nM of GsMTx4 or water as the vehicle control. vSMCs shown in green and the endothelium in magenta. Arrows highlight vSMCs associated with the dorsal aorta. B,C) Quantification of tagln positive vSMCs associated with (B) the dorsal aorta or (C) the cardinal vein following treatment with GsMTx4 (p = 0.0008, unpaired two-tailed t-test; N = 25 and 30). D) Confocal images of the medial trunk of Tg(tagln:eGFP; kdrl:mCherry-CAAX) zebrafish carrying mutations to piezo1 and piezo2a.1. Arrows highlight vSMCs associated with the dorsal aorta. E,F) piezo1+/-;piezo2a.1-/- individuals were crossed to piezo1+/-;piezo2a.1+/- individuals to generate the indicated genotypes. Quantification is shown of tagln positive vSMCs associated with the dorsal aorta (E) or cardinal vein (F) piezo1+/-; piezo2+/- (N = 10); piezo1+/+; piezo2+/- (N = 6); piezo1+/+; piezo2-/- (N = 4); piezo1+/-; piezo2-/- (N = 10); piezo1-/-; piezo2+/- (N = 10). piezo1+/-; piezo2+/- vs. piezo1+/-; piezo2-/- (p = 0.0184), piezo1+/-; piezo2+/- vs. piezo1-/-; piezo2+/- (p = 0.0232). The box plots show the median versus the first and third quartiles of the data. The whiskers indicate the spread of data within 1.5x above and below the interquartile range. Statistics were preformed using one-way ANOVA with uncorrected Fisher’s LSD. piezo1-/-;piezo2a.1-/- double mutants lack robust blood flow and have edema; therefore, they were excluded from the analysis. Data in B was normalized to the control artery condition to allow for collating data from fish across multiple experiments. scale bar = 50 μm.
|
