
Fig. 4
- ID
- ZDB-FIG-250218-61
- Publication
- Mo et al., 2024 - NAT10 functions as a pivotal regulator in gastric cancer metastasis and tumor immunity
- Other Figures
- All Figure Page
- Back to All Figure Page
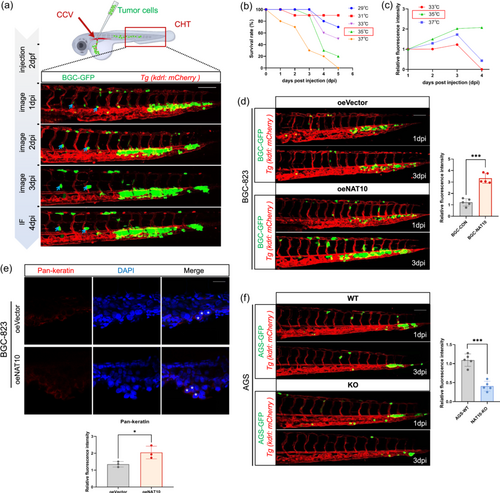
Establishment of the xenograft zebrafish model validates that NAT10 facilitates growth of GC cells. (a) Upper panel shows modeling image of a 2 dpf Tg (kdrl: mCherry) zebrafish embryo showing the tumor cell injection site, the common cardinal vein (CCV, red arrow) and the caudal hematopoietic tissue (CHT) in the tail region where cells typically arrest (red box). Lower panel shows confocal images of xenograft zebrafish model injected with BGC-GFP cells for the indicated times (1, 2, 3 and/or 4 dpi) and the tumor cell for each time point (blue arrow). Green, cancer cells. Red, vessels. Scale bars: 50 μm. (b) Zebrafish embryo survival curves under the temperature gradient of incubation after transplantation. (c) Fluorescence intensity is recorded from the first day post injection, once per day for a total of 4 days. (d) Representative confocal images for tumor cell proliferation in the tail vessels of zebrafish after transplantation of NAT10 overexpressed tumor cells. Scale bars: 50 μm. (e) Whole-mount IF staining showed the expression of Keratin as regulated by NAT10 in vivo at the endpoint and quantitatively analyzed. Asterisk: nucleus. Scale bars: 20 μm. (f) Representative confocal images for tumor cell proliferation in the tail vessels of zebrafish after transplantation of NAT10 knocked out tumor cells. Scale bars: 50 μm. GC, gastric cancer. |