FIGURE

Fig. 2

ID
ZDB-FIG-250212-62
Publication
Liu et al., 2025 - Mcm5 mutation leads to silencing of Stat1-bcl2 which accelerating apoptosis of immature T lymphocytes with DNA damage
Other Figures
All Figure Page
Back to All Figure Page
Fig. 2

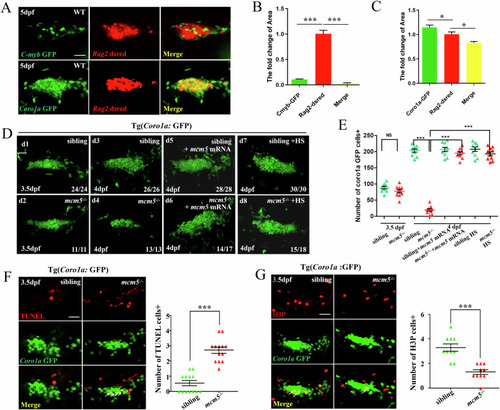
Immature T lymphocytes undergo cell death in mcm5−/− embryos.

AC Analysis of the expression of Rag2:DsRed, C-myb:GFP and Coro1a:GFP at 5 dpf. The expression of C-myb:GFP almost did not overlap with Rag2:DsRed expression (A, B, yellow column, n = 3, 3%), and most Rag2:DsRed-positive cells overlapped with cells labeled with Coro1a:GFP (A, C, yellow column, n = 3, 82.4%). D, E No significant difference was observed for Coro1a:GFP cells in siblings (d1, n = 24) and mcm5−/− embryos (d2, n = 11) at 3.5 dpf (d1-d2, E; n = 11), but at 4 dpf, the number of Coro1a:GFP cells was greatly decreased (d3-d4, E; n = 13). This phenotype can be rescued by injecting mcm5 mRNA at the 1- to 4-cell stage (d5-d6, E; n = 17) or heat shock-inducing mcm5 expression at 3 dpf (d7-d8, E; n = 18). Here we counted the Coro1a:GFP labeled cells in each single slice, then added them together as the whole T cell number. F TUNEL-positive Coro1a:GFP cells were increased in mcm5−/− embryos (n = 13) compared with their siblings (n = 13). G There were fewer H3P-positive Coro1a:GFP cells in mcm5−/− embryos (n = 10). Here H3P is a mitotic marker Histone H3 phosphorylated at Serine 10. Scale bars, 40 μm. Statistical analyses of the expression of Coro1a:GFP are shown on the right. For (B, C, EG), the data were presented as means ± SD; The P-values (t-test; two-tailed); NS, not significant. “***” P < 0.001.

Expression Data

Expression Detail
Antibody Labeling
Phenotype Data

Phenotype Detail
Acknowledgments
This image is the copyrighted work of the attributed author or publisher, and ZFIN has permission only to display this image to its users. Additional permissions should be obtained from the applicable author or publisher of the image. Full text @ Cell Death Dis.