
Fig. 3
- ID
- ZDB-FIG-250204-12
- Publication
- Nie et al., 2025 - Palmitoylation-mediated NLRP3 inflammasome activation in teleosts highlights evolutionary divergence in immune regulation
- Other Figures
- All Figure Page
- Back to All Figure Page
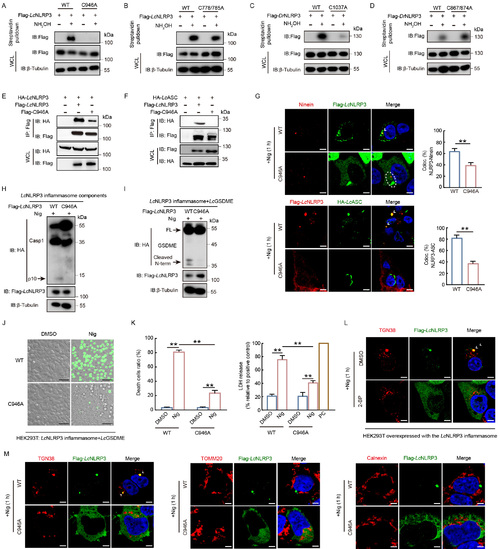
Palmitoylation of teleost NLRP3 at a unique residue facilitates membrane translocation A, B: ABE assay of palmitoylation levels of Flag-LcNLRP3, C946A, or C778/785A mutants overexpressed in HEK293T cells, with or without hydroxylamine. C, D: ABE assay of palmitoylation levels of Flag-DrNLRP3, C1037A, or C867/874A mutants overexpressed in HEK293T cells, with or without hydroxylamine. Ε: Immunoblotting of WCL and anti-Flag IPs derived from HEK293T cells transfected with HA-LcNLRP3 and either wild-type (WT) Flag-LcNLRP3 or Flag-LcNLRP3 C946A mutant to examine LcNLRP3 oligomerization. F: Immunoblotting of WCL and anti-Flag IPs derived from HEK293T cells transfected with HA-LcASC and either WT Flag-LcNLRP3 or Flag-LcNLRP3 C946A mutant to examine interactions between LcNLRP3 and LcASC. G: Immunofluorescence images showing colocalization of LcNLRP3 puncta with MTOC marker ninein or formation of LcNLRP3-ASC puncta in HEK293T cells overexpressing WT LcNLRP3 or C946A mutant, and other inflammasome components, stimulated with nigericin. Cells exhibiting LcNLRP3-ninein or LcNLRP3-ASC colocalization in each group were quantified. Mean±SD, n=3 fields, **: P<0.01. Data were analyzed using an unpaired two-tailed Student’s t-test. H: Caspase-1 processing (p10) in HEK293T cells overexpressing WT LcNLRP3 or C946A mutant, along with other inflammasome components, stimulated with nigericin for inflammasome activation. I: Gasdermin E (cleaved N-term) processing in nigericin (40 μmol/L)-stimulated HEK293T cells overexpressing WT LcNLRP3 or C946A mutant with other inflammasome components. J: Live cell imaging of pyroptosis in nigericin (40 μmol/L)-stimulated HEK293T cells overexpressing WT LcNLRP3 or C946A mutant, along with other inflammasome components and HA-LcGSDME, using SYTOX Green nucleic acid staining. Scale bars: 50 μm. K: Quantification of percentage of cells showing positive SYTOX Green signals and relative levels of LDH release in (I). Mean±SD, n=3, **: P<0.01. Data were analyzed using an unpaired two-tailed Student’s t-test. L: Immunofluorescence images showing colocalization of LcNLRP3 with trans-Golgi network marker TGN38 in nigericin (40 μmol/L)-stimulated HEK293T cells overexpressing LcNLRP3 inflammasome components, with or without 2-BP (100 μmol/L). Scale bars: 5 μm. M: Immunofluorescence images showing colocalization of LcNLRP3 with TGN38 (trans-Golgi network marker), TOMM20 (mitochondria marker), and calnexin (ER marker) in nigericin-stimulated HEK293T cells overexpressing WT LcNLRP3 or C946A mutant with other inflammasome components. Scale bars: 5 μm. All immunofluorescence images are representative of three independent experiments. Blue indicates nuclear staining by DAPI; arrowheads indicate puncta. |