
FIGURE
Figure 3
- ID
- ZDB-FIG-250110-123
- Publication
- Widder et al., 2024 - Identification of Potential Sepsis Therapeutic Drugs Using a Zebrafish Rapid Screening Approach
- Other Figures
- All Figure Page
- Back to All Figure Page
Figure 3
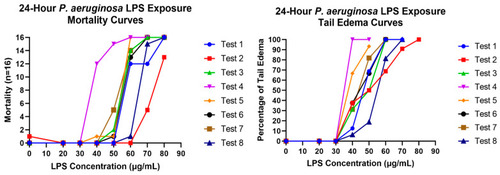
LPS concentration response curves for replicate tests during the optimization phase of assay development. The left graph depicts the percentage of fish with tail edema in response to increasing |
Expression Data
Expression Detail
Antibody Labeling
Phenotype Data
Phenotype Detail
Acknowledgments
This image is the copyrighted work of the attributed author or publisher, and
ZFIN has permission only to display this image to its users.
Additional permissions should be obtained from the applicable author or publisher of the image.
Full text @ Life (Basel)