|
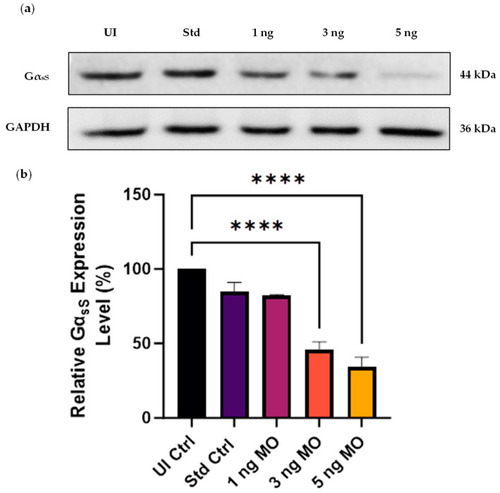
Western blot analysis of the knockdown efficiency of the three gnas Morpholino (MO) doses at 48 hpf. (a) Representative blot of the GαsS expression level in non-injected control (UI Ctrl) and standard control (Std Ctrl) embryos compared to those injected with 1, 3, and 5 ng of gnas MOs. The Std Ctrl embryos were injected with 5 ng of Std Ctrl MO. Whole zebrafish tissue lysates were used to extract total protein (~40 µg loaded per well) and GAPDH served as a loading control. (b) The band intensities were quantified using ImageJ software, followed by normalization of the GαsS band intensity to that of GAPDH. The GαsS expression level was expressed as a percentage of that in the UI Ctrl embryos. One-way ANOVA followed by Tukey’s multiple comparisons test were performed (**** p < 0.0001). Each bar represents the mean ± SEM (n = 4).
|