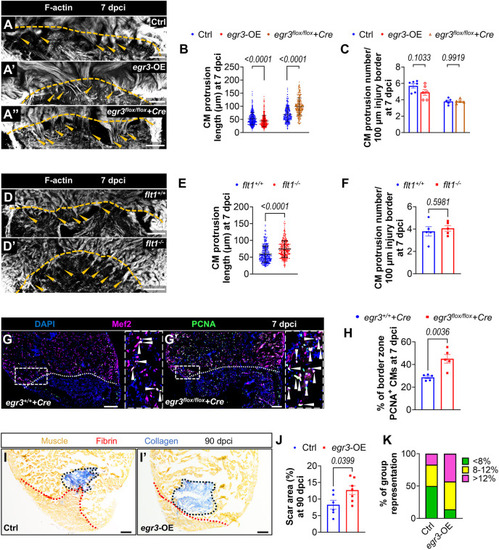
flt1 deletion promotes cardiomyocyte repopulation by downregulating egr3. (A-A″) Phalloidin staining for F-actin (white) on 50 μm sections of cryoinjured ventricles from Ctrl [n=6 for egr3 OE, n=5 for Tg(hsp70l:Cre);egr3flox/flox, A], egr3 OE (n=6, A′) and Tg(hsp70l:Cre);egr3flox/flox (n=5, A″) zebrafish at 7 dpci. Orange arrowheads indicate the protruding CMs in the injured area; orange dotted lines indicate the injured area. (B,C) Quantification of CM protrusion length (B) and number (C) in the indicated genotypes at 7 dpci. (D,D′) Phalloidin staining for F-actin (white) on 50 μm sections of cryoinjured ventricles from flt1+/+ (n=5, D) and flt1−/− (n=5, D′) zebrafish at 7 dpci. Orange arrowheads indicate the protruding CMs in the injured area; orange dotted lines indicate the injured area. (E,F) Quantification of CM protrusion length (E) and number (F) in the indicated genotypes at 7 dpci. (G,G′) Immunostaining for Mef2 (CM nuclei, magenta) and PCNA (green) with DAPI (blue) counterstaining on sections of cryoinjured ventricles from Tg(hsp70l:Cre);egr3+/+ (n=5, G) and Tg(hsp70l:Cre);egr3flox/flox (n=5, G′) sibling zebrafish at 7 dpci. Arrowheads indicate PCNA+ CMs. Areas outlined are shown at higher magnification on the right. (H) Percentage of PCNA+ CMs in the border zone of the indicated genotypes at 7 dpci. (I,I′) AFOG staining on sections of cryoinjured non-transgenic Ctrl (n=6, I) and egr3 OE (n=7, I′) ventricles at 90 dpci. Orange, muscle; red, fibrin; blue, collagen. Black and red dotted lines delineate the scar and regenerated muscle wall areas, respectively. (J) Percentage of scar area relative to ventricular area in the indicated genotypes at 90 dpci. (K) Graphs showing the representation of groups of different scar area sizes in the indicated genotypes at 90 dpci. Scale bars: 100 µm. Data in C,F,H,J are mean±s.e.m. (two-tailed, unpaired Student's t-test with P values shown in the graphs). Data in B,E are mean±s.d. (two-tailed, Mann–Whitney U test with P values shown in the graphs).
|
