
Fig. 5
- ID
- ZDB-FIG-240903-166
- Publication
- Wong et al., 2024 - ALS-linked VapB P56S mutation alters neuronal mitochondrial turnover at the synapse
- Other Figures
- All Figure Page
- Back to All Figure Page
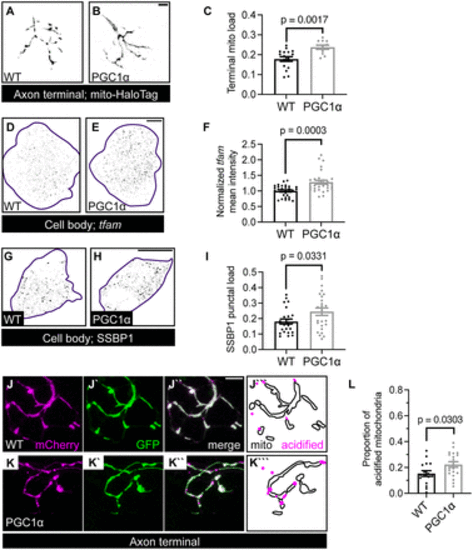
PGC1α regulates mitochondrial density and mitophagy in the axon terminal. A, B, Representative images of mitochondria, visualized with HaloTag localized to the mitochondrial outer membrane via a Tomm20 signal sequence, in axon terminals of a WT (A) and PGC1α transgenic (B) at 4 dpf. C, Quantification of axon terminal mitochondrial load in PGC1α transgenic. D, E, Representative images of HCR RNA FISH labeling tfam mRNA in the pLL ganglion (purple outline) of WT (D) and PGC1α transgenic (E). F, Quantification of tfam mean fluorescence intensity normalized to WT. G, H Images of SSBP1 immunostaining in single pLL neurons (purple outline) in WT (G) and PGC1α transgenic (H). I, Quantification of SSBP1 puncta number normalized to the cell body area. J, K, pLL axon terminal of WT (J) and PGC1α transgenic (K) expressing the mitophagy indicator. Distribution of acidified (magenta) and unacidified (outline) mitochondria is illustrated (J```, K```). L, Quantification of axon terminal mitophagy in PGC1α transgenic. Scale bar, 5 μm in B and J``; 10 μm in E and H. Each data point for C, F, I, and L represents the average calculated from an individual animal. All data represented as mean ± SEM. Student's t test in C, I, and L. Mann–Whitney U test in F. |