
FIGURE
Fig. 2
- ID
- ZDB-FIG-240903-149
- Publication
- Li et al., 2024 - Metabolomics-based profiling of anti-inflammatory compounds from Mentha spicata in shanghe, China
- Other Figures
- All Figure Page
- Back to All Figure Page
Fig. 2
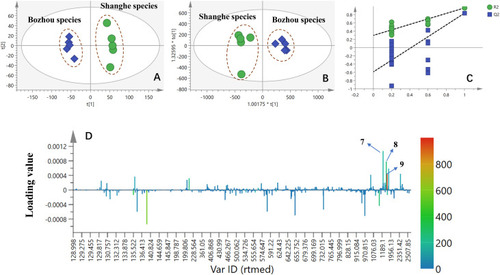
Metabolic profiling of the LC-MS spectra of SM and BM extracts in positive modes. (A) PCA score plots, (B) OPLS-DA score plots, (C) validation plots of the model, and (D) coefficient-coded loading plots (3 potential biomarkers corresponding to the compounds in Table 1 ). |
Expression Data
Expression Detail
Antibody Labeling
Phenotype Data
Phenotype Detail
Acknowledgments
This image is the copyrighted work of the attributed author or publisher, and
ZFIN has permission only to display this image to its users.
Additional permissions should be obtained from the applicable author or publisher of the image.
Full text @ Heliyon