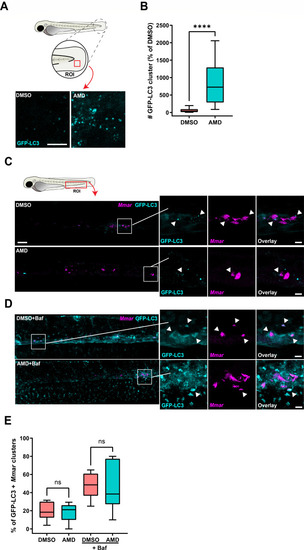
Amiodarone induces an increase in (auto)phagosomes, without affecting autophagic targeting of Mmar clusters. (A) Confocal microscopy max projection of transgenic GFP-LC3 zebrafish larvae treated with 5 µM of amiodarone or vehicle control dimethyl sulfoxide (DMSO). Treatment was started at 3 dpf and larvae were fixed with 4% paraformaldehyde at 4 dpf for imaging. Representative max projection images of GFP-LC3-positive vesicles in the indicated region of imaging (ROI) in the tail fin are shown. Cyan shows GFP-LC3-positive vesicles. Scale bar annotates 10 µm. (B) Quantification of GFP-LC3 structures is shown in panel A. Data were normalized to the control, and data from two independent experiments were combined (n = 16–17 per group). Boxplots with 95% confidence intervals are shown, and the black line in the boxplots indicates the group median. Statistical significance was tested using a Mann-Whitney test. (C) Confocal microscopy max projection of mCherry-expressing Mmar-infected transgenic GFP-LC3 zebrafish larvae treated with 5 µM of amiodarone or vehicle control DMSO. Treatment was started at 1 hpi, and at 2 dpi, larvae were fixed with 4% paraformaldehyde for imaging. Representative max projection images of the ROI in the CHT region are shown. Cyan shows GFP-LC3-positive vesicles and magenta shows Mmar. Scale bar annotates 50 µm. Enlargement of areas indicated in panel C: cyan shows GFP-LC3-positive vesicles and magenta shows Mmar. Arrowheads indicate GFP-LC3-positive Mmar clusters. Scale bar in the left panel annotates 50 µm and in the right panel 10 µm. (D) Confocal microscopy max projection of mCherry-expressing Mmar-infected transgenic GFP-Lc3 zebrafish larvae treated with 5 µM of amiodarone and 160 nm of bafilomycin or vehicle control DMSO. Treatment was started at 1 hpi, and at 2 dpi, larvae were fixed with 4% paraformaldehyde for imaging. Representative max projection images of the ROI in the CHT region are shown. Cyan shows GFP-Lc3-positive vesicles and magenta shows Mmar. Scale bar annotates 50 µm. Enlargement of areas indicated in panel D: cyan shows GFP-LC3-positive vesicles and magenta shows Mmar. Arrowheads indicate GFP-LC3-positive Mmar clusters. Scale bar in the left panel annotates 50 µm and in the right panel 10 µm. (E) Quantification of GFP-LC3-positive Mmar clusters in the CHT region shown in panels A and D normalized to the control (n = 8 per group). Boxplots with 95% confidence intervals are shown, and the black line in the boxplots indicates the group median. Statistical analysis was performed using a Kruskal-Wallis with Dunn’s multiple comparisons test. ns, non-significant and ****P < 0.0001.
|
