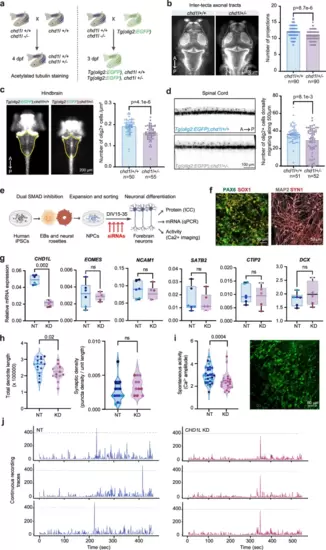
Functional impact of low CHD1L expression in neurons and oligodendrocytes. a Schematic of zebrafish experimental design. b Dorsal view of control and chd1l+/− larvae at 4 dpf stained with acetylated tubulin. Barplot of the inter-tecta axonal tract projections count of 4 dpf control and chd1l+/− larvae (Wilcoxon test, mean ± SEM, n = 3 replicate/genotype, 30 larvae/replicate). c Dorsal view of Tg(olig2:EGFP);chd1l+/+ and Tg(olig2:EGFP);chd1l+/− at 3 dpf with the hindbrain used for olig2-positive cells count outlined in yellow. Barplot of the number of olig2-positive cells per µm2 in the hindbrain of Tg(olig2:EGFP);chd1l+/+ and Tg(olig2:EGFP);chd1l+/− larvae at 3 dpf (Wilcoxon test, mean ± SEM, n = 3 replicate/genotype, 12–20 larvae/replicate). d Lateral view of the spinal cord of Tg(olig2:EGFP);chd1l+/+ and Tg(olig2:EGFP);chd1l+/− larvae at 3 dpf. Barplot of the number of olig2-positive cells migrating dorsally from the spinal cord of Tg(olig2:EGFP);chd1l+/+ and Tg(olig2:EGFP);chd1l+/− larvae at 3 dpf (Student’s T-test, mean ± SEM, n = 3 replicate/genotype, 15–20 larvae/replicate). e Schematics of iPSCs experimental design. f Representative confocal images of markers of neuroectodermal NPCs (PAX6, SOX1) and differentiated neurons (MAP2, SYN1), all performed in duplicates in three independent subject lines. g qPCR data of CHD1L, EOMES, SATB2, CTIP2 and DCX transcripts in non-targeting (NT) and CHD1L knock-down (KD) neurons. Box plots indicate the median (line), 25th and 75th percentile (box), min and max (whiskers). All data points correspond to experimental duplicates in three independent subject lines (different colors, two-sided Mann–Whitney U test). h Quantification of neurite length (μm) and synaptic density in NT and KD neurons (two-sided Mann–Whitney U test). i Quantification of background-corrected changes in calcium-sensitive dye fluorescent intensity in NT and CHD1L KD neurons. A representative confocal image is shown. Data points correspond to averaged active regions (ROIs, 10 cells) per field of view (two-sided Mann–Whitney U test). Five to six fields of view were included for each subject line and condition. j Representative calcium imaging traces from NT and CHD1L KD neurons (3 ROIs). A anterior, P posterior, dpf days post-fertilization, NT non-targeting siRNA, KD CHD1L-targeting siRNA. n.s non-significant. Source data are provided as a Source Data file.
|
