
Fig. 2
- ID
- ZDB-FIG-240703-50
- Publication
- Chouhan et al., 2024 - Cell-size-dependent regulation of Ezrin dictates epithelial resilience to stretch by countering myosin-II-mediated contractility
- Other Figures
- All Figure Page
- Back to All Figure Page
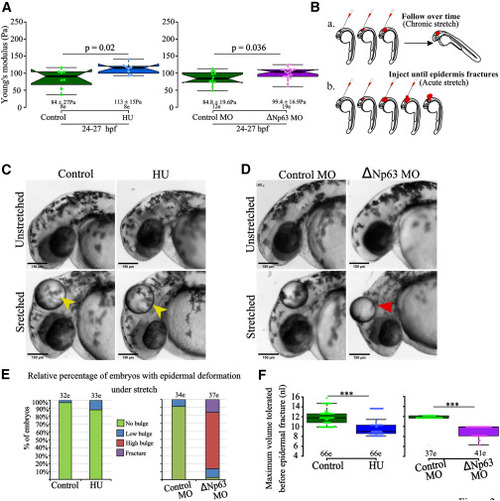
Increase in cell size following proliferation inhibition compromises mechanical resilience in the developing epidermis (A) Boxplots show the increase in average Young’s modulus of the epidermis in HU-treated (left) and ΔNp63 MO (right) epidermis between 24 and 27 hpf. (B) The schematic depicts the chronic stretch (a) and acute stretch (b) paradigms to assess the epidermal response under proliferation inhibition, shown in (C)–(F). (C–F) Bright-field images of the heads of zebrafish larvae showing epidermal deformation phenotypes (C and D) and the number of embryos showing the extent of deformation by qualitative assessment (E) (low to high bulge to rupture; see STAR Methods and Figure S4Aa) upon oil injection under HU treatment (C and E) and upon ΔNp63 knockdown (D and E) at 12 hpi (yellow arrowhead: low deformation, red arrowhead: high deformation). The boxplots (F) represent the volume of injected oil tolerated before the epidermis fractures under given treatments at 24 hpf. Quantification and statistical analyses were performed using n = the total number of embryos analyzed for each treatment, as indicated in the graphs (e, embryos). Scale bar: 150 μm. hpf, hours post-fertilization; hpi, hours post-injection; c, cells. ∗∗∗p < 0.001, as assessed by t test in (A) and Mann-Whitney test in (F). Note that the power of the t test in (A) ranges from 0.6 (for HU treatment) to 0.2 (for ΔNp63 MO). |