
Fig. 2
- ID
- ZDB-FIG-240628-94
- Publication
- Lu et al., 2024 - Cytokines IL-1β and IL-10 are required for Müller glia proliferation following light damage in the adult zebrafish retina
- Other Figures
- All Figure Page
- Back to All Figure Page
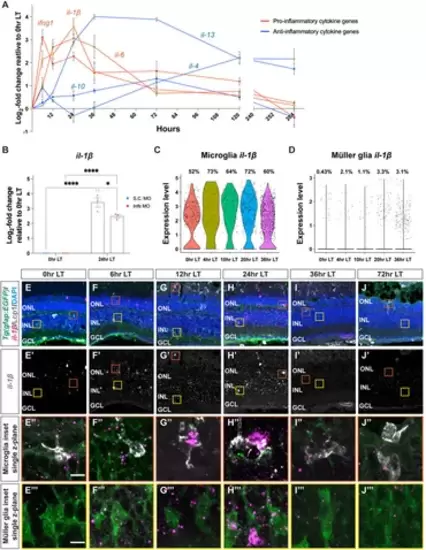
Cytokine genes are dynamically expressed following light damage. (A) qRT-PCR analysis of three cytokine genes, which are commonly associated with inflammatory effects: il-1β (red line, yellow dot), il-6 (red line, green dot), and ifng1 (red line, red dot) and three cytokine genes, which are usually associated with inhibiting inflammation: il-10 (blue line, blue dot), il-13 (blue line, yellow dot), il-4 (blue line, green dot), across light treatment (LT) time course (0, 6, 12, 24, 36, and 72 h LT) and 1-day (120 h) and 7-days (264 h) recovery (after completing 96 h constant LT). All values are normalized to 18 s rRNA reference gene. The mRNA expression levels are displayed as log2-fold change relative to 0 h LT from three independent replicates with a pool of 6-7 dorsal retinas for each replicate. (B) qRT-PCR analysis of il-1β expression at 0 h and 24 h LT in Standard Control morphants (S.C. MO, blue circles) and tnfa morphants (red circles). Data was normalized to 18 s rRNA reference gene and displayed as log2-fold change relative to the S.C. MO control group. For the qRT-PCR, three independent replicates were performed with a pool of 6-7 dorsal retinas for each replicate. (C,D) Previously published single-cell RNA-Seq data (Hoang et al., 2020) were analyzed by violin plots for il-1β expression in microglia (C) and Müller glia (D). The time points included in the snRNA-Seq dataset correspond to 0, 4, 10, 20, and 36 h LT. (E–J‴) Confocal images of dark-adapted albino;Tg(gfap:EGFP)nt11 zebrafish retinas that were isolated at 0 (E–E’’’), 6 (F–F’’’), 12 (G–G’’’), 24 (H–H’’’), 36 (I–I’’’), and 72 h LT (J–J’’’). Retinal sections were labeled by in situ hybridization with a probe for il-1β magenta: (E–J,E’’–J’’’), grayscale: (E’–J’). Sections were also immunostained to detect GFP Müller glia, green: (E–J,E’’-J’’’) and Lcp1 microglia, grayscale: (E–J, E’’–J’’’), with DAPI counterstain nuclei, blue: (E–J, E′′–J‴). Orange boxes in (E–J) were magnified to better portray il-1β signal in microglia (E’’–J’’) and yellow boxes in E-J were magnified to better portray il-1β signal in Müller glia (E’’’–J’’’). The magnified images in (E’’–J’’’) represent single z-plane images. ONL, outer nuclear layer; INL, inner nuclear layer; GCL, ganglion cell layer. Scale bar in E is 20 µm and is the same for F-J’ and scale bars in E’’ and E’’’ are 5 µm and are the same for (F’’–J’’) and (F’’’–J’’’), respectively. Graphs represent the Mean ± SEM and n = 3. *, p < 0.05, ****, p < 0.0001. |