
Fig. 2
- ID
- ZDB-FIG-240627-13
- Publication
- Stagaman et al., 2024 - The zebrafish gut microbiome influences benzo[a]pyrene developmental neurobehavioral toxicity
- Other Figures
- All Figure Page
- Back to All Figure Page
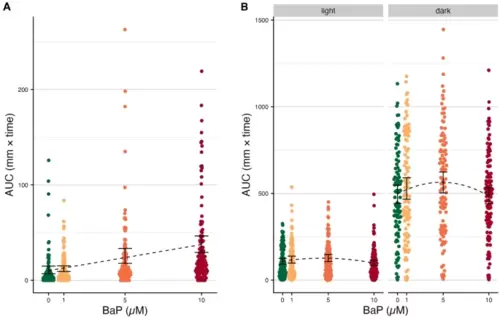
Behavior assay results (A) Embryonic photomotor response (EPR) movement data (n = 573). Areas under the curve (AUCs) for the movement curves from panel A, measured only in the window between the dotted lines. Black error bars indicate the 95% C.I.s for the mean AUC per BaP exposure level. The black dotted line indicates the estimated association from linear regression. (B) Larval photomotor response (LPR) movement data (n = 573). AUCs for the movement curves from panel A, split by cycle (light versus dark). Black error bars indicate the 95% C.I.s for the mean AUC per BaP exposure level. The black dotted line indicates the estimated association from polynomial linear regression. |