
Fig. 2
- ID
- ZDB-FIG-240620-92
- Publication
- Kawano et al., 2022 - NudC regulated Lis1 stability is essential for the maintenance of dynamic microtubule ends in axon terminals
- Other Figures
- All Figure Page
- Back to All Figure Page
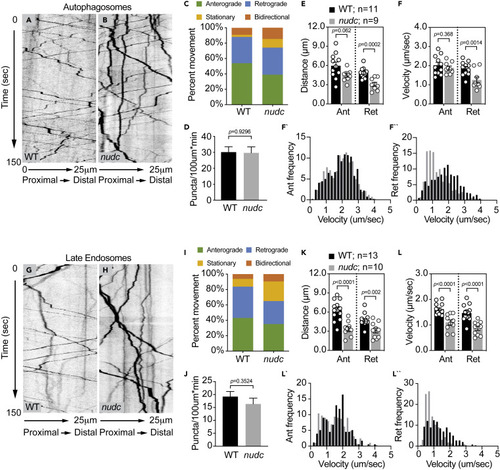
Decreased retrograde transport velocity of autophagosomes and late endosomes in nudc mutants (A and B) Kymograph analysis of LC3-labeled autophagosome transport. (C) The autophagosome transport frequency in nudc mutants. Anterograde transport frequency decreases but the percent of autophagosomes moving in the retrograde direction is not changed (ANOVA; anterograde: p = 0.0045; retrograde: p = 0.7890). Stationary particle frequency increases (ANOVA; p = 0.0023). (D) Total number of autophagosomes in the axon is unchanged (ANOVA). (E and F) Quantification of autophagosome transport distance and velocity show defects for both during retrograde transport (ANOVA). (F` and F``) Histograms of binned transport velocities show a clear shift to slower velocities for retrograde transport in nudc mutants. (G and H) Kymograph analysis of Rab7-labeled late endosome transport. (I) The percent of retrograde late endosome transport decreases in nudc mutants (ANOVA; p = 0.0346), while stationary particle frequency increases (ANOVA; p = 0.0031). (J) Total number of late endosomes in the axon is unchanged (ANOVA; p = 0.3524). (K and L) Quantification of late endosome transport distance and velocity show defects in both the anterograde and retrograde directions (ANOVA). (L` and L``) Binned histograms of transport velocities show a clear shift in retrograde transport toward slower speeds. Data are expressed as mean ± S.E.M. Sample sizes indicated on the graph. |